
More help:
NWEA Support
Have an idea?
Share it!
–See Other Class Level Reports–

| Description |
Shows three pictures of growth, all based on national norms: projections so you can set student growth goals, summary comparison of two terms so you can evaluate efforts, and an interactive quadrant chart so you can visualize growth comparisons. |
| Applicable Tests | MAP Growth and MAP Growth K‑2 |
| Intended Audience |
Instructional coach, teacher, counselor |
|
Required Roles |
Instructor, Administrator, or Assessment Coordinator (School or District) |
|
Date Limits |
Available during the current and previous academic year |
Video Overview
Projected Growth Sample

|
| Achievement Status | Growth | ||
|---|---|---|---|
| RIT Score Range (+/– SEM) |
Achievement Percentile Range (+/– SE) |
Projected RIT Score |
Projected Growth |
| Test score for the term, shown in bold (+/– standard error of measurement). |
Percentile ranking of the achievement reached for the given term, shown in bold (+/– standard error). It is a comparison to similar students in NWEA's norms study, not a comparison to fellow classmates. It also incorporates the weeks of instruction before testing, as set in the MAP preferences for your district or school. |
Typical score expected for matching peers within the NWEA norms study—those in the same grade who have the same RIT score in the first term, and the same Weeks of Instruction before testing (as set in the MAP preferences for your district or school). |
Number of RIT points the student is typically expected to grow. |
| SEM and SE = Standard Error of Measurement (an estimate of the precision; if retested soon after, the student's score would be within this range most of the time). If it is unusually high, a footnote (*) indicates you should qualify the results with data from other terms or other measurements. | |||
Summary Growth Sample

|
| Growth – Student | |||
|---|---|---|---|
| Observed Growth |
Observed Growth SE |
Growth Index | Met Projected Growth |
|
Difference between the RIT in the first term and the end term. |
Provides an estimate of the Observed Growth precision by incorporating the standard error of measurement (SEM) from each term. If it is unusually high, a footnote (†) indicates you should qualify the results with data from other terms or other sources. |
Difference between the Observed Growth and Projected Growth. A zero (0) indicates the student exactly met projection. Inappropriate for comparing students (use Conditional Growth Index). |
Indicates whether students met growth projections (Yes) or fell short (No). A ‡ mark indicates the Observed Growth Standard Error (SE) could be large enough to put the outcome in question, and you should qualify these results with other points of data. Consider this example:
In this case, the Standard Error (6.4) is large enough to potentially drop Observed Growth (9) below what was projected (4):
|


| Growth – Comparative | |
|---|---|
| Conditional Growth Index | Conditional Growth Percentile |
|
Enables you to compare growth between any of your students. This measurement correlates your student’s growth with the growth patterns of matching peers within the NWEA norms study (same grade, starting RIT score, and Weeks of Instruction before testing). In addition, this measurement involves a conditioning process that incorporates how difficult it was for each student to grow. As a result, you can see each student’s growth in the same national context and compare them fairly, regardless of grade or subject. A value of zero (0) corresponds to the mean (typical) growth, indicating that growth exactly matched projections. Values above zero indicate growth that exceeded projections, and values below zero indicate growth below projections. |
Translates the Conditional Growth Index to U.S. national percentile rankings for growth. An index of 0 equates to 50th percentile. |
Conditional Growth Explanation
Summary Section

|
|
|---|---|
| Percent of Students who Met Growth Projection |
Percentage of students with a Growth Index value greater than or equal to zero. |
| Percent of Projected Growth Met |
Ratio of total Observed Growth to total Projected Growth. A performance of 100% is average, meaning the student growth equaled the projections. This measure can provide a good indicator of group performance. However, be careful. The assumption is that students will grow at close to the same rate. One or two outliers can skew the percentage for the group. For example, a percentage of 150% could mean that one student's growth surpassed all others. |
| Count of Students with Growth Projections and Valid Beginning and Ending Term Scores | Total of students, including those who showed growth and those who did not. |
| Count of Students who Met or Exceeded their Projected Growth |
Number of students with a Growth Index value greater than or equal to zero. The count includes students flagged as either Yes or Yes‡ in the Met Projected Growth column. |
| Median Conditional Growth Percentile | Percentile that falls in the middle of all the Conditional Growth Percentiles shown. |
Summary with Quadrant Chart
To visualize and compare students' growth in a given class, use the online quadrant chart, which graphs students by:
- Conditional Growth Percentile, on the vertical axis
- Percentile rank for the end term, on the horizontal axis

Spreadsheet Output
In addition to PDF and online output, you can choose a spreadsheet output for the Achievement Status and Growth report. It provides all of the data in a single, comma-delimited file (CSV format).
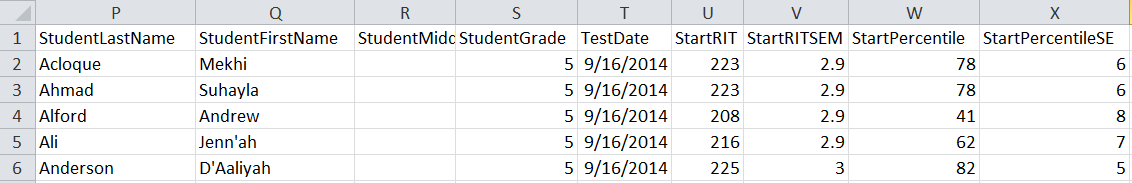
In general, the spreadsheet columns match the PDF and online output, with a few differences:
- ASGType: Type of Achievement Status and Growth (ASG) selection you made in the Growth Comparison option (either a Summary of actual growth or a Projection of future growth).
- WIStartTerm and WIEndTerm: How many Weeks of Instruction (WI) are specified in the Manage Preferences > Manage Terms page for each term.
-
OptionalGroupingCategory and Group: If an Optional Group was selected in the report options, the category (such as Gender) and the group (Male/Female/X) appear.
-
OptionalGrouping columns (near the end): Summary calculations for each group, such as Male and Female.
-
- Start and End terms: First and second terms in the growth comparison, such as fall and winter.
- StartRITSEM / StartPercentileSE and EndRITSEM / EndPercentileSE: Indicates the Standard Error of Measurement (+ or –) in each term. If it is unusually high, footnotes (+ or *) appear to indicate you should qualify the results with data from other terms or other sources.
-
StartTestDuration and EndTestDuration: How many minutes the student tested in each term.
- Summary data (columns AN to AR): The same values repeat for a given class and subject.
- StartGrowthandAchievement and EndGrowthandAchievement: Where the student falls on the quadrant chart for each term, assuming the quadrants are set at 50th percentile:
- High G/Low A: High Growth / Low Achievement
- High G/High A: High Growth / High Achievement
- Low G/Low A: Low Growth / Low Achievement
Low G/High A: Low Growth/ High Achievement
- Note: The growth (High G or Low G) shows the same value for both Start and End terms, but the achievement (High A or Low A) may differ between the terms.
-
ConditionalGrowthPercentileAxis and AchievementPercentileAxis: Refers to the Quadrant Chart axis. It always shows 50, even if you change the axis in the chart.
Options for Generating Achievement Status and Growth Report
The following fields are required when ordering this report:
Term Rostered: Term when students were enrolled (“rostered”) into MAP. Typically, you can leave it set to the current term (choices are limited to the current and previous academic years).
Term Tested: Term with the test events you want to see. For example, in the fall you might want to see results from the previous spring. Choices are limited to terms that are concurrent with or that precede the Term Rostered.
School, Instructor, Class: The choices you have depend on your MAP role. The Assessment Coordinator can choose from across the district. Other roles are limited to assigned schools and classes.
Growth Comparison Period: Indicates the beginning and ending term in which student growth is analyzed to summarize actual growth or project future growth.
Optional Grouping: Includes additional summary data for each class by gender or ethnicity in addition to the standard summary by subject. The default option is None.
Small Group Display:Overrides the report summary default and reports summary data for groups of fewer than ten students with growth test scores. Because summary data for small groups is not statistically reliable, it is typically not included in reports.