More help:
NWEA Support
Have an idea?
Share it!
As you use MAP Growth data, refer to these common questions.
To inform your educational decisions and communication plans, please use the resources curated in the Norms 2025 Toolkit.
Overview of MAP Growth Data
By using MAP Growth tests, your schools can gain insight into the growth of all students. What makes it possible is the NWEA MAP Growth norms study, which is representative of schools across the nation. NWEA norms enable you to compare student achievement in a single term (i.e., achievement norms) as well as across terms (i.e., growth norms):
Use growth norms to:
- project the amount of growth that is typical for similar students
- set appropriate growth targets, based on the projection
- evaluate the observed growth in a subsequent term
Growth projections are not the same as projected proficiency, which appears on the Student Profile and the Projected Proficiency Summary reports.
Projected proficiency comes from a separate NWEA study that links MAP results to your state's summative assessment or to college readiness tests.
Student-level Growth
Here are some key considerations:
-
Typical growth projections are just a starting place to help you set your students' growth goals, which could be higher or lower.
-
Always balance projections with other information and observations to make targets appropriate for your students.
- In terms of accuracy, the NWEA norms study includes several factors that help to make projections as accurate as possible, including:
- how many weeks of instruction students received on average before testing (as set in the MAP preferences for your district or school).
- how high students scored in the first term (because students starting with a high score generally do not raise their score as much as students starting with a low score).
-
It is not uncommon for students to have the same growth projections on reports, due to rounding limitations.
-
Keep in mind that projections are an estimate intended to show the growth that similar students have shown on average, according to the NWEA norms study.
-
High school students, especially those with high achievement, may have only a small growth projection. In this case, focus on the average growth across the larger group, rather than individual student growth.
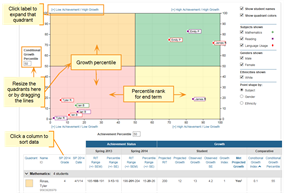
The Conditional Growth Percentile shows how well each student grew relative to matching peers within the NWEA norms study. Watch the following explanation:
Visualize growth using the interactive Summary with Quadrant Chart within the Achievement Status and Growth Report.

Low growth is a signal to find out more information. There are various questions to consider:
- How much effort did the student put into the recent MAP Growth test?
- Check the Test Duration, shown on the Class Profile report. Does it differ from most students?
- Check how many other tests the student took on the same day. Was the student fatigued?
- When did testing occur? Was the student anxious to finish?
- Is the student already at a high level of achievement?
- The higher the achievement, the lower the expectation of growth.
- Are the student's needs getting met?
- Talk with the student and parents. Is there a pattern of behavior that gives cause for concern?
-
How high is the Observed Growth Standard Error? (Shown on the Achievement Status and Growth Report.)
For example, if the growth is –3, but the standard error is 4, then it's possible that growth is not negative.
School and District Growth
Here are some key considerations:
- In terms of accuracy, the NWEA norms study includes several factors that help to make projections as accurate as possible, including:
- how many weeks of instruction students received on average before testing (as set in the MAP preferences for your district or school)
- how high students scored in the first term (because students starting with a high score generally do not raise their score as much as students starting with a low score)
-
High school students, especially those with high achievement, may have only a small growth projection. In this case, focus on the average growth across the larger group, rather than individual student growth.
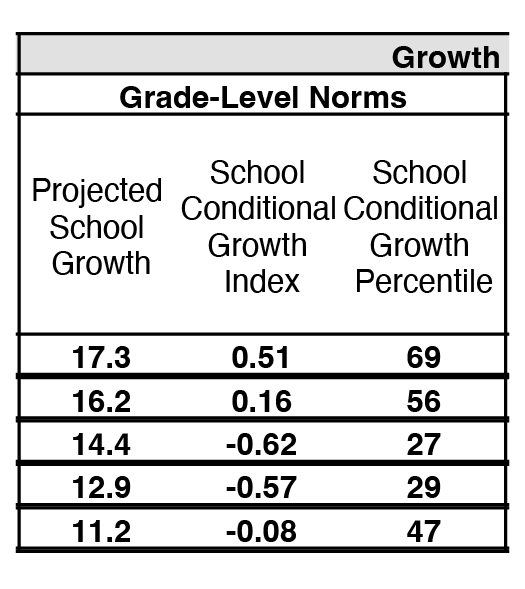
On the Student Growth Summary Report use the Grade-Level Norms to see how the growth produced in your school compares to other US schools.

The School Conditional Growth Percentile shows how the average growth of students in a single grade within the school grew relative to other US schools teaching the same grade.
The District Summary Report shows growth progression for each grade from all of the past MAP Growth testing.

Also, on other reports, you can check the results from any of the past three test terms.
Low growth is a signal to find out more information. There are various questions to consider:
- How much effort did the students put into the recent MAP Growth test?
- Check the Test Duration, shown on the School Profile Report. Does it differ from other grades?
- Check how many other tests the students took on the same day. Were they fatigued?
- When did testing occur? Were the students anxious to finish?
REMINDER: MAP Growth norms are sensitive to the number of weeks of instruction students have received at the time of testing. Your reports use the specific Weeks of Instruction setting from your MAP preferences, which may differ from the defaults used in this document (Fall = 4 weeks, Winter = 20 weeks, Spring = 32 weeks). As a result, you may see differences between the percentile ranks and growth projections in your reports and those in these resources.
To ensure the most accurate and meaningful results, it’s important to update your Weeks of Instruction to reflect your actual testing dates. Learn more: