More help:
NWEA Support
Have an idea?
Share it!
Report Basics
To get started using your MAP Growth results, follow these key steps:
To learn details about the data in each report, see MAP Report Details. Or, for more background, see RIT Scores.
![]() Print Resources:
Print Resources:
Step 1: Find the Right Report
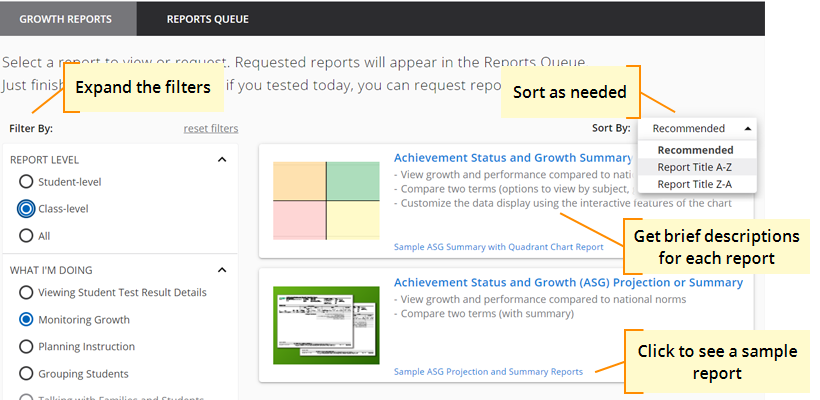
Access all MAP Growth assessment results from View Reports > MAP Growth. The report choices that appear depend on the MAP role assigned to you. For example, an Instructor can see student‑level and class‑level reports but not school-level reports, as shown in this figure:

Step 2: Choose Report Options

When you request a report, options appear so you can control the data and appearance. The following summary provides an orientation to the common report options.
Also quickly find detailed descriptions by choosing Help when you request a report and the options appear.
Time Period Options
For most reports, you can choose to see results back to one year prior. A few reports, like Student Profile, show results for all prior years.
To help you compare results from prior terms, many reports include the options Term Rostered and Term Tested. For example, in the fall you might want to see results from the previous spring (the Term Tested):

Data Organization Options
Depending on the report, you will see options for School, Instructor, Class, and Subject. Under each option, the choices that appear depend on the MAP role assigned to you. For example, as a teacher (Instructor role), you can only view your class, but a school leader (Administrator role) can choose from multiple classes.
Many reports also enable you to group students by Gender, Ethnicity, or school Program (within district-level reports). If you choose a grouping, the report also shows totals for each group. The precision of the grouping information depends on how your leaders prepared the roster for the term.
Step 3: Download from the Reports Queue
Reports that create a PDF or spreadsheet often take a few minutes to process, and sometimes longer. You can return later and retrieve your reports from the Reports Queue tab (You can also access Reports Queue from the start page by choosing MAP Growth from the main menu). Reports appear in the order created, but you can sort by any column:

Single PDF files open in your browser but reports that contain many PDFs will download to a ZIP file. The ZIP filename matches the Report ID shown in the queue, and you can use your operating system to extract the contents.
Using Student Quick Search

You can pinpoint a student's results using the Student Quick Search, available from the MAP Growth reports page. Once you find the student, you can choose any of these reports:
- Student Profile—Modern and comprehensive online report
- Student Progress—Older-style PDF report
If Student is Not Found:
- The term could have ended and the new term is not ready. For the term to be ready, your district must:
- Set the start date of the term—see Date Setup Before Testing
- Upload the roster of students for this term—see Roster Upload Overview
- Or the student you seek is not assigned to your class. You can try these solutions:
- Make sure you used the correct log-in credentials
- Edit your profile to add the student to your class—see Manage Users
Time Required for Reports
Keep in mind the processing time required for reports and certain report data:
- Nightly Data Update — To keep reports running fast, the MAP system performs updates to the reporting database only at night. This means that changes that users make to data do not appear in reports until the next day, after those changes transfer from the main database to the separate reporting database. Example changes are:
- testing
- adding a student ID
- reassigning test events
- modifying a test window
- Generation Time — The time it takes to generate reports depends on the report's priority, size, and volume (number of records included in the report). HTML-based reports are available quickly, but they are not stored in the Reports Queue.
District Selection
Depending on your MAP role, you may need to select a district before you can access MAP reports. After you select a district, the reports available to you cover only the schools in that district. (There are currently no reports that incorporate data for multiple districts.)
To change the district, re-open the menu selection under View Reports.
The MAP roles affected are State Data Administrator, State Read-Only User, and State Technology Coord.