
More help:
NWEA Support
Reports for Administrators
Once testing is done, your reports are available. This page will show you the reports available for administrators. What would you like to do?
See reports for:
You can also:
Reports Available by Role
| Role | Testing Progress | Term Summary | Term Comparison | Benchmark Matrix | Individual Student Reports |
|---|---|---|---|---|---|
| District Assessment Coordinator | All schools in district | All schools in district | All schools in district | Not available | Not available |
| School Assessment Coordinator | Assigned schools | Assigned schools | Assigned schools | Assigned schools | Assigned schools |
| Administrator | Assigned schools | Assigned schools | Assigned schools | Assigned schools | Assigned schools |
| Instructor | Not available | Not available | Assigned classes | Assigned classes | Assigned classes |
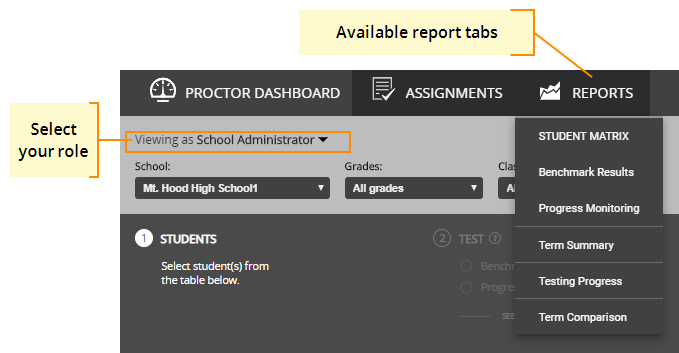
Select the term, school, grade, and class that you want to view using the drop-down lists at the top of the page.
Testing Progress Report
You’ll see a chart that shows test completion status for the school as a whole, followed by the completion status for each class in the school. You can filter this list by class or grade.
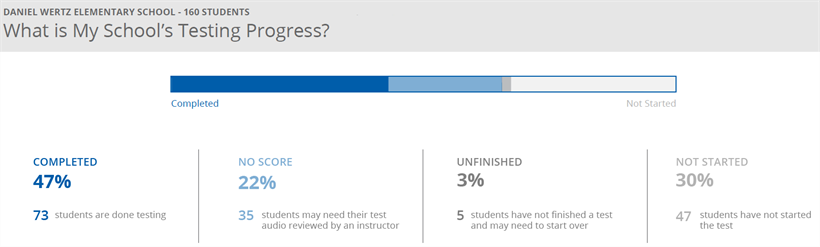
The statuses are as follows:
- Completed: Students who have finished a test
- No Score: Students who have finished a test, but their audio was unscorable; instructors may hand-score the results, or you may wish to retest
- Unfinished: Students who have started but not completed a test
- Not Started: Students who have not started a test
Below the test completion chart, you’ll see a listing of all classes and the percentage of tests each class has completed.
Benchmark Matrix and Individual Student Reports
You can open individual student details from the Benchmark Matrix report. For details, see:
Term Summary Report
The Term Summary report provides visual indications of student performance for an entire grade. The scores shown represent the best performance for each student.
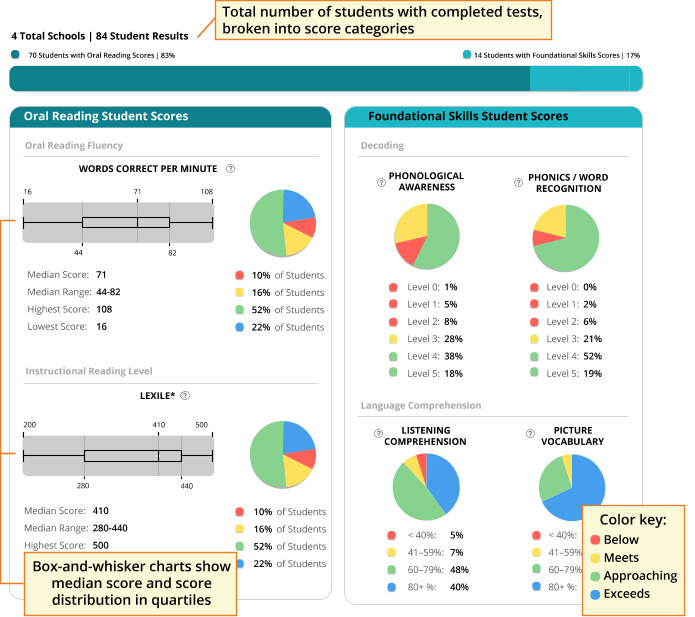
Oral Reading Scores
The Oral Reading section shows two charts for both WCPM and instructional reading level scores. In each case, the charts show the same data in two different ways:
- The box-and-whisker plot displays the score range for students in each quartile
- The pie graph shows the percentage of students in each expectation level
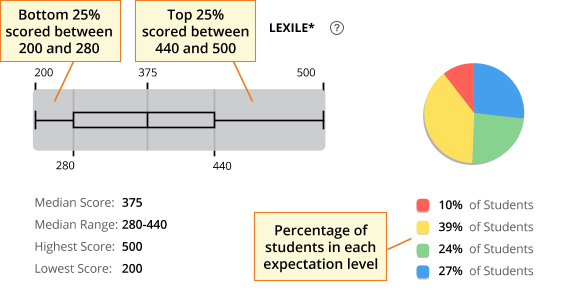
Interpreting the Lexile results:
See:Reports for Teachers.
Foundational Skills Scores
The Foundational Skills score charts show the percentage of students in each zone of proximal development (ZPD) level. The colors correspond to the expected performance levels of students in that grade.
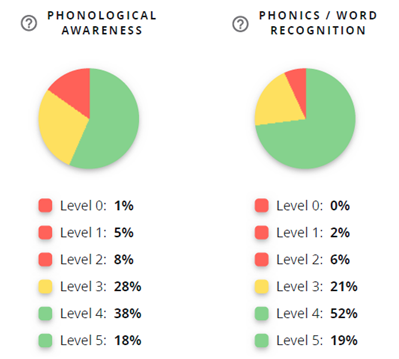
Note: For descriptions of what each ZPD level measures, see Zone of Proximal Development Levels. For a listing of all performance levels, see Grade-Level Expectations.
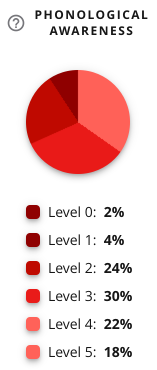
If all students in a grade performed at the same expectation level, that color shows in different shades:
Exporting the Term Summary Report
Choose Export to save the Term Summary report data as an Excel® spreadsheet. This will export the data for all completed tests for the term, school, and grade that you’re currently viewing. The following table shows the results fields included in the export.
| Field Name | Definition |
|---|---|
| FS_ListeningCompLevel | Category of expectation* of the student’s ability to identify the matching picture after listening to a sentence |
| FS_ListeningCompScore | Percentage correct on the task of identifying the matching picture after listening to the sentence |
| FS_PictureVocabLevel | Category of expectation* of the student’s ability to identify the matching picture after listening to a vocabulary word |
| FS_PictureVocabScore | Percentage correct on the task of identifying the matching picture after listening to a vocabulary word |
| FS_PhonologicalAwarenessLevel | Category of expectation*of the student’s awareness of the phonological structure, or sound structure, of words |
| FS_PhonologicalAwarenessZPD | ZPD level of the student’s awareness of the phonological structure, or sound structure, of words |
| FS_PhonicsWordRecognitionLevel | Category of expectation* of student’s development of phonemic awareness |
| FS_PhonicsWord RecognitionZPD | ZPD level of student’s development of phonemic awareness |
| SentenceReadingFluencyLevel | Category of expectation of the student’s ability to read a simple sentence and identify the matching picture |
| SentenceReadingFluencyScore | Percentage correct on the task of reading a simple sentence and identifying the matching picture |
| OR_OralReadingRateLevel | Category of expectation of the student’s reading rate |
| OR_OralReadingRateScore | Words read correctly per minute |
| OR_OralReadingAccuracyLevel | Category of expectation of student’s reading accuracy |
| OR_OralReadingAccuracyScore | Score of student’s ability to read accurately and decode unfamiliar words |
| OR_LiteralComprehensionLevel | Category of expectation of the student’s ability to process information that was read and understand its meaning |
| OR_InstructReadLevel | Category of expectation of the student’s reading ability level |
| OR_LexileMidpoint | The Lexile score of the student’s instructional reading level |
| *Below, approaching, meeting, or exceeding expectations | |
Term Comparison Report
The Term Comparison report allows comparison of data across up to six testing terms. You can choose the terms that you want to include. Administrators can view data for any schools to which they have access; teachers can view a report for their classes.
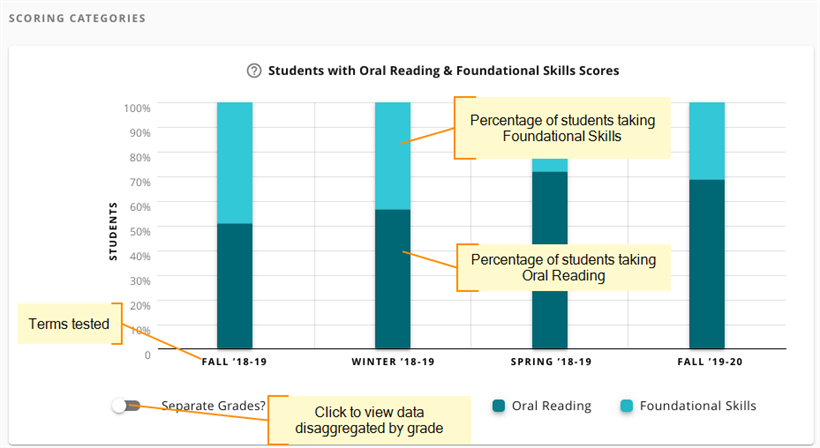
The report has two sections; the first, Scoring Categories, shows the proportions of students tested that took each test, Foundational Skills or Oral Reading. You can choose to disaggregate this data by grade.
The second section has information on subscores. You can choose the subscores that you wish to see on the report. You can also choose to see the data for each subscore section showing all students or students disaggregated by grade, as numeric values or percentages, and as a chart or a bar graph.
This is an example of a subscore chart. Each subscore will have its own chart.
