
More help:
NWEA Support
Reports for Teachers
Once testing is done, your reports are available. This page will show you the reports available for teachers. Here are some of the things you can do.
See reports for:
You can also:
- Find out if the word count per minute for my student is on grade level
- Know the expected Lexile® levels for a grade
- Listen to a recording of a student’s test
If you have problems:
This video shows how to access your reports.
Reports Conventions
On all reports, color-coding is used to indicate student performance.
 Yellow indicates approaching grade-level expectations
 Green indicates meeting grade-level expectations
 Blue indicates exceeding grade-level expectations
 Red indicates below grade-level expectations
The No Expectation performance level may appear in reports for some pre-K, kindergarten, and first-grade students. This level, denoted as NE, will be used where there is no applicable grade-level expectation. For example, if a beginning kindergartener makes it to the Word Reading subtest (which is not expected of a kindergarten student), then gets 2 of 10 correct, NE will be reported.
Scaled Scoring for Oral Reading Passages
MAP Reading Fluency adapts passage difficulty to meet the needs of the reader. When a student reads well, the test provides higher-difficulty passages.
Students read multiple passages within a session and over time. It is difficult to determine whether changes in student scores are due to changes in student progress or due to changes in passage difficulty. Test equating allows us to compare scores across tests. The concept of equating is quite similar to currency exchange rates. Every currency can be expressed in terms of another currency, such as the US dollar. Similarly, scores on one reading passage can be expressed in terms of scores on another. Such equated scores provide a better indication of students’ reading fluency.
NWEA’s scaled-words-correct-per-minute (SWCPM) score is an equated score that adjusts the raw words-correct-per-minute (WCPM) score for differences in passage difficulty. The SWCPM reflects changes in student ability more accurately than the raw WCPM does.
NWEA used the equipercentile equating method to place reading fluency scores onto the same scale as that of a reference passage. The following graphic helps explain how the equipercentile method works. The graphic shows the relationship between students’ scores on Passage A and their scores on the reference passage, Passage B. The reference passage's lower Lexile Measure indicates that it is the easier passage. Consequently, raw WCPM scores on the reference passage tend to be higher than those on Passage A.
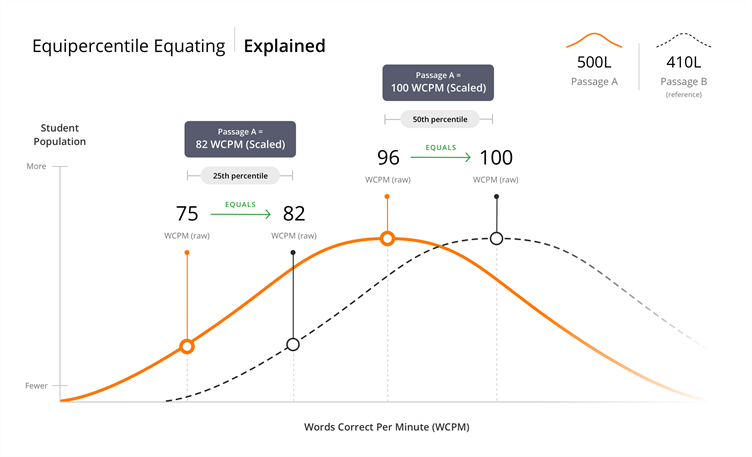
The percentile rank shows what percentage of students score at or below a given score. For instance, the 50th percentile for Passage A is 96 and the 50th percentile for the reference passage is 100. This means that 50% of the students in the sample scored at or below a WCPM score of 96 on Passage A, and 50% of these same students scored at or below a WCPM score of 100 on the reference passage. Similarly, the 25th percentile for Passage A is 75 WCPM and the 25th percentile for the reference passage is 82 WCPM.
Student raw scores on Passage A are equated with raw scores with the same percentile rank on the reference passage. The scaled score on the test passage is the same as the raw score on the reference passage. A raw WCPM score of 96 on Passage A equates to a raw WCPM score of 100 on the reference passage; thus, 100 is the scaled WCPM for a raw WCPM of 96 on Passage A. A raw WCPM score of 75 on Passage A equates to a raw WCPM score of 82 on the reference passage; thus, 82 is the scaled WCPM corresponding to a raw WCPM score of 75 on Passage A.
Use the scaled WCPM scores as you would use any WCPM score, knowing they also take into account the complexity of the text read by students.
Please note that the new, scaled WCPM scores are applicable for English tests and reporting only at this time. Spanish test results and reports will continue to show the raw WCPM score.
The maximum reportable scaled score on reports is 140+; the minimum is 20.
How Are Items Scored?
MAP Reading Fluency recognizes any self-corrections a student makes as long as the mistake is corrected in a timely fashion, in close proximity to the mistake. In other words, if a student decodes incorrectly and doesn’t “catch” the mistake until the following sentence in the passage, then the self-correction is not noted, and the mistake is counted against the student in terms of Accuracy Rate and WCPM. Specific error types are scored as follows for both machine-scored and hand-scored tests:
| Error Type | How Scored |
|---|---|
| Omissions (leaving out a word) | Incorrect |
| Substitutions (substituting one word for another) | Incorrect |
| Self-corrections | Correct if in close proximity to the error |
| Insertions (adding extra words) | Not counted as incorrect but affect scores by increasing time |
Finding Reports
Test results for classes and students and audio playback are found under the Reports tab. Choose Benchmark Results under Benchmark Matrix to see the Benchmark Matrix report.
Benchmark Matrix Reports
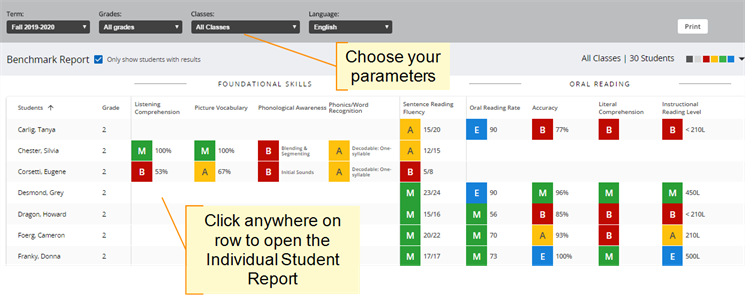
On the Benchmark Matrix report, you’ll see a color-coded scoring measure of how each student in your class performed on the major components of reading development. Only the most recently completed test will be shown on this report. Oral reading fluency performance is reported relative to grade-level expectations. Quartiles are reported and are color-coded.
The names of subscores appear across the top of the report. Only the most recent test taken in the term will appear on this report. Research-Only tests are not shown on the Benchmark Matrix.
Click any row in the report to open the Individual Student report for that student.
To print the Benchmark Matrix report, click Print.
Data can also be exported as a .csv file; click Export.
Individual Student Reports
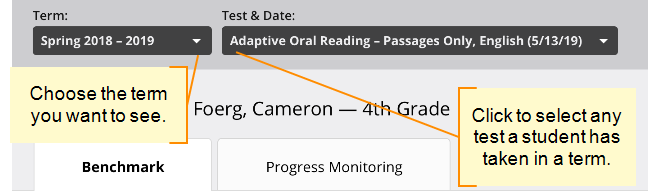
To see an Individual Student report, click anywhere in the row for the student in the Benchmark Matrix report. If you want to see a report from a different term, choose that term. Reports will differ based on which test type the student took. If a student has taken more than one test in a term, click the Test and Date drop-down to select a test. This drop-down only appears if a student has taken more than one test in a term.
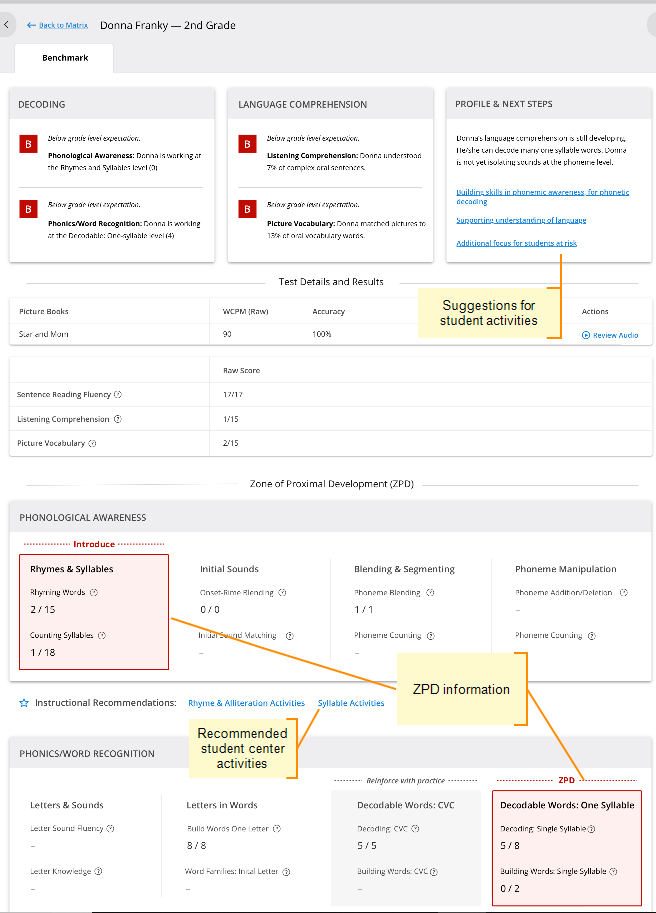
Students who were administered Foundational Skills tasks will have information on their zone of proximal development (ZPD) scores for each task type on the report. Tasks within a learner's ZPD are those tasks the learner can do with assistance— the "sweet spot" where instruction is most beneficial for each student, just beyond his or her current level of independent capability.
Structure of the Student Reports
The Individual Student report includes WCPM and decoding accuracy for picture book reading, as well as the student’s scores on listening comprehension, picture vocabulary, phonemic awareness, phonics/word recognition, and sentence reading fluency. Click the link under Profile and Next Steps to see suggestions for individual student activities. Sentence Reading Fluency may appear as a subtest if the student did well in phonics.
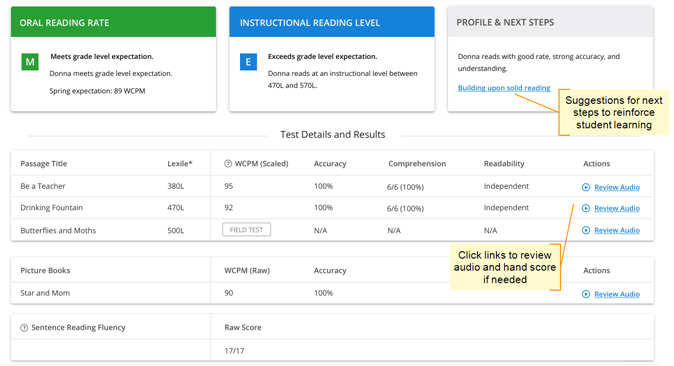
If students took Adaptive Oral Reading and advanced to passage reading:
The Individual Student report includes a performance-level score for oral reading rate and instructional reading level in addition to all performance results and details. It also includes next steps and recommendations for instruction. The instructional reading level identifies the Lexile level of text that is challenging, but not frustrating, for the student. The performance-level score tells you how the student’s reading rate compares with grade-level expectations. Click the link under Profile and Next Steps to see suggestions to support individual student needs.
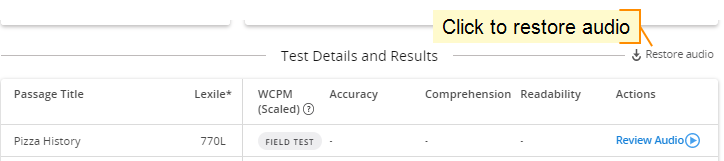
Also listed in the report is the WCPM score for each passage. Scaled WCPMs are provided for tests taken in English. Currently, raw scores are provided for Spanish; scaled scores will be provided once NWEA has enough data to construct a scaled-score table. Links are provided to listen to audio recordings. Select Review Audio to hear the complete recording.
No Score (NS)
No Score is assigned when the recorded audio for a test cannot be scored by the speech scoring engine.
To resolve an NS score, retest the student or hand-score the passage. See Audio Review/HandScoring.
| Reasons for an NS score | Tips for obtaining a valid score |
|---|---|
| The student attempted less than 75% of the passage. | Ensure students are reading the entire passage out loud. |
| The audio could not be scored due to short duration and/or poor quality. | Make sure that the background noise is minimal and the microphone is working correctly. Make sure the student is reading the text on the screen. |
| The volume of the recording was too low. | Be sure students are reading out loud and not whispering. Check that the microphone is properly placed. |
| The volume of the recording was too high. | Be sure students are reading out loud and not shouting. Check that the microphone is properly placed. |
If students took a Research-Only test:
The “Research-Only” assessments are intended for MAP Reading Fluency users who are participating in an NWEA Research program. Research-Only tests are not shown on the Benchmark Matrix but do appear on the Individual Student report. Limited data is available on these reports. The Research-Only test is not adaptive.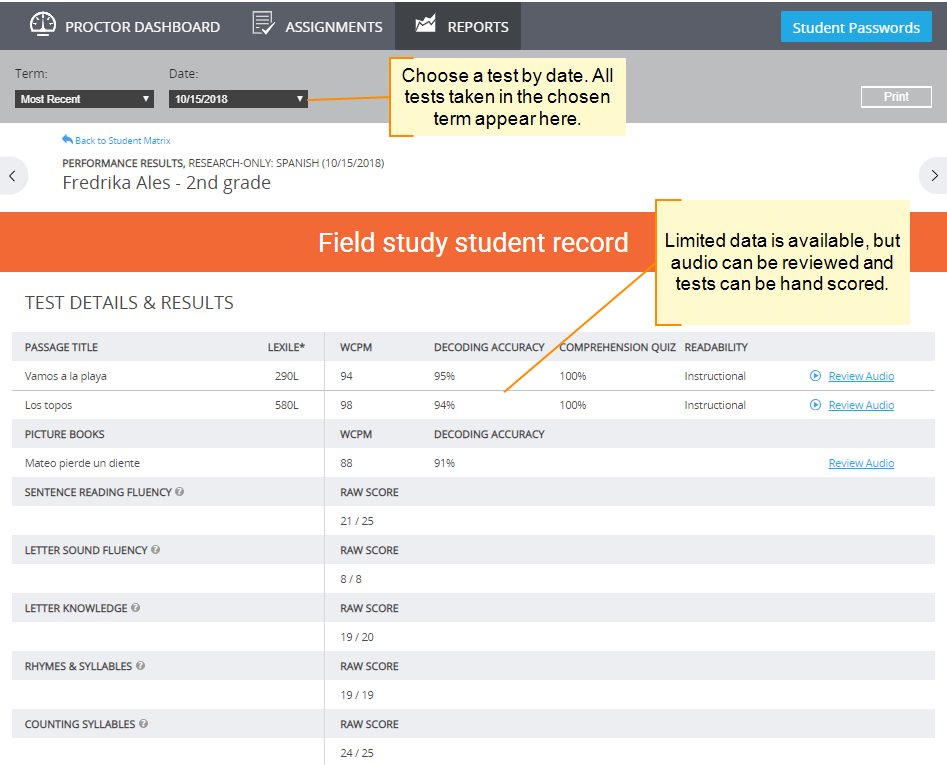
Audio Review/HandScoring
Hand Score lets you score a student audio recording by hand and overwrite the automatically generated WCPM score. Because they are not scored, picture books and field test passages cannot be hand-scored. To access hand scoring, select Review Audio from the student’s individual report to access the passage, along with the student’s audio recording and the Hand Score feature.
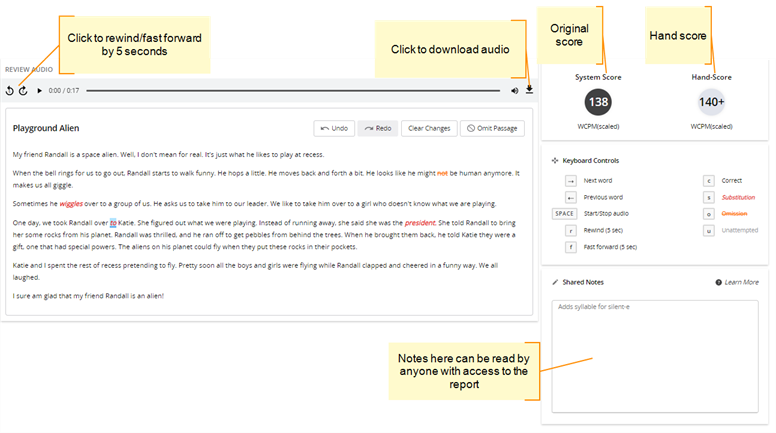
Scores are shown above the Keyboard Controls table on the right side of the page. The original score appears in the dark circle on the left. If it is the score that was automatically assigned after the student tested, System Score will appear above the circle. If the student has a previous hand score, Hand Score will appear above the circle. The score that will be assigned if the current hand scoring session is saved appears in the light gray circle on the right.
Press the Play button or the space bar to start audio playback and begin hand-scoring. Use the arrow keys on your keyboard to move through the words in the passage. Other keys let you score the passage:
| Key | Action |
|---|---|
| s | Indicates a word substitution (such as “gave” for “have”) |
| o | Indicates an omission (student leaves a word out) |
| u | Used on the last word a student reads to indicate unattempted/incomplete audio. The remainder of the text will be grayed out. |
| c | Erases an incorrect marking and marks the word as correctly read |
| r | Rewinds the recording 5 seconds |
| f | Advances the recording 5 seconds |
Save your hand score if you wish to keep it or select Clear Changes to discard the changes. If a previous hand score was saved, you can use Revert Score to discard it.
Selecting Omit Passage hides a student’s score from the student’s individual report. You may wish to do this, for example, if the audio quality of a recording is too poor to score. If you omit a passage by mistake, you can restore a suppressed score by selecting Restore Score on the Test Details and Results line of the student's Individual Student report.
Any record that has been hand-scored will be marked in the test details section of the student’s report. It may take several minutes for the results to appear.
You can download the audio by clicking the download arrow on the playbar. The audio will download as a .wav file.
Term Comparison Reports
See Term Comparison Report under Reports for Administrators.
Progress Monitoring Reports
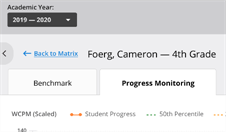
To access Progress Monitoring reports, choose Reports and click the Progress Monitoring tab.
Progress Monitoring Matrix Report
This report has a list of students with progress monitoring results, including their most recent scores.
Use the Export button to download your progress monitoring data.

Progress Monitoring Student Report
The student report shows basic data on all Progress Monitoring tests that a student has taken. Choosing Grade Level Percentiles will allow you to compare the student's performance to grade-level percentiles.
