
More help:
NWEA Support
Have an idea?
Share it!
–See Other Student Level Reports–
Batch Print for Family Report (BETA)
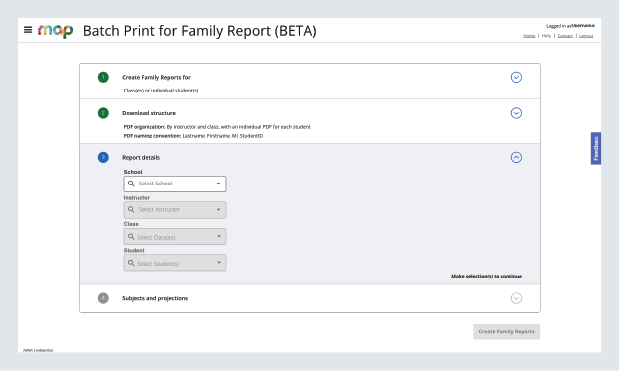
Selections on Batch Print for Family Report
The Batch Print for Family Report (BETA) is an essential tool for communicating your students’ performance to their families. Use new batch print functionality to produce and distribute Family Reports at scale, presenting a comprehensive view of each student's academic achievement, growth, and projected proficiency.
Getting started
You can access Batch Print for Family Report based on requirements described in the table below.
Requirements for Batch Print for Family Report
| Condition | Explanation |
|---|---|
| Applicable MAP tests | MAP Growth and MAP Growth K–2 (not Screening tests) |
| Date range for reportable data |
Batch Print for Family Report displays the current term and data from the current and previous academic years, showing data for up to 6 terms Note: Only official RIT scores are considered reportable data; learn more at Invalid Tests and Unofficial RIT Scores |
| MAP Roles for report access | Instructor, Administrator, School Assessment Coordinator, and District Assessment Coordinator; learn more at Choose MAP Roles |
Using Batch Print for Family Report
Depending on your role, you can use Batch Print for Family Report to generate PDF files of the following options:
-
A single student
-
Multiple students within a class
-
A single, entire class
-
Multiple classes in a single school
-
A single, entire school
-
Multiple schools within a district
Use the process described below to produce a ZIP folder of Family Report PDF files:
-
Log in at https://start.mapnwea.org and choose MAP Growth from the main menu.
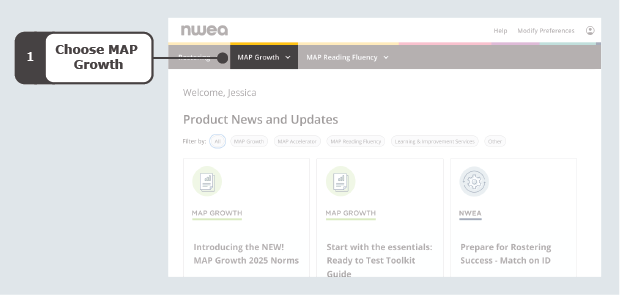
On the start page, choose MAP Growth
-
Select Batch Print for Family Report.
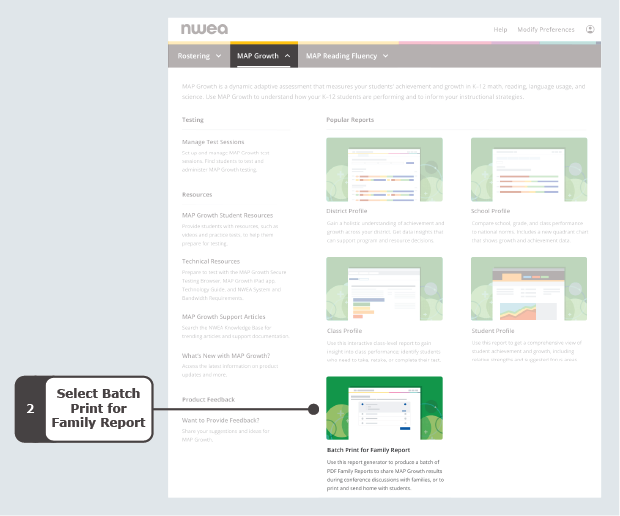
Select the Batch Print for Family Report tile from the MAP Growth menu on the start page
Note: You can also find the Batch Print for Family Report on the Reports Landing Page. Follow the path from the start page > MAP Growth > MAP Growth Reports (under Other Reports) > Batch Print for Family Report. -
Choose your output target for creating Family Report files:
-
School(s)
Note: This option is only available for users with an Administrator, School Assessment Coordinator, and/or District Assessment Coordinator role. -
Class(es) or individual students
Select Continue.
-
-
Determine the download structure for your Family Report files as applicable:
-
By school, with an individual PDF for each student—to produce a ZIP folder with individual PDFs for each student
Note: This option is only available for users with an Administrator, School Assessment Coordinator, and/or District Assessment Coordinator role. -
By instructor and class, with an individual PDF for each student—to produce a ZIP folder with PDFs in subfolders by teacher and class
-
By instructor and class, with whole class PDF including a report for each student (up to 100 students per class)—to produce a ZIP folder with whole class PDFs in subfolders by teacher and class; classes with more than 100 students will produce individual PDFs for each student instead of a whole class PDF
Note: This option is not yet available for users with only an Instructor role.
Select Continue.
-
-
Select your preferred PDF naming convention:
-
Lastname_Firstname_MI_StudentID
-
StudentID
Select Continue.
-
-
Define report details as applicable:
-
School
-
Instructor
-
Class
-
Student
Note: The fields of Instructor, Class, and Student are only available when creating Family Reports for Class(es) or individual students.Select Continue.
-
-
Select your subjects and projections:
-
Subjects—choose Language Arts, Mathematics, and/or Science
-
Projections—choose SAT, ACT, and/or State Linking Study
Select Continue.
-
-
Review your selections and create your files. You can adjust any details by selecting the arrow for a section to expand it.
Note: If you make any edits to a section at this stage, you must select or confirm the details in subsequent sections of the batch printing process before proceeding. -
Select Create Family Reports to generate a ZIP folder for your PDF files.
-
Select Go to Reports Queue to monitor progress and download your ZIP file when it is ready.
Note: If your report fails to generate, select Retry.
Exploring your files
Your batch print request produces a ZIP folder of PDF files. Review the sections below to learn more about each kind of file:
Individual Family Report
The Family Report PDF displays each student’s achievement and growth for the subjects you selected.
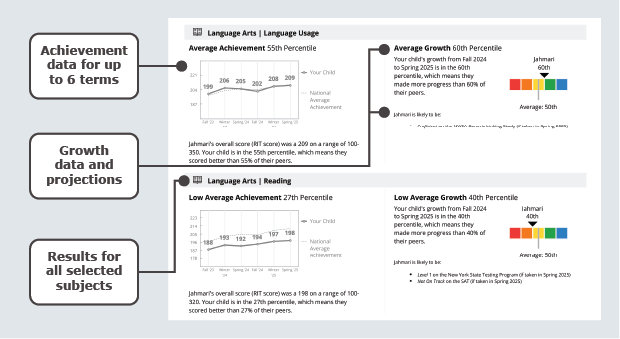
Sections of the Family Report with achievement and growth data
Data and explanations for the Family Report
| Data Point | Explanation |
|---|---|
| Percentile | Norm-based information about where a student’s observed score falls within the range of scores produced by other same-grade US students. |
| Achievement |
Student performance at a single moment in time. You can use achievement percentiles to understand how student scores compare to other same-grade US student score. On the Family Report, achievement is charted through official RIT scores for up to 6 terms from the current and previous academic year. |
| Growth |
An inference about how student performance changes across two moments in time. You can use growth percentiles to understand how changes in student scores compare to changes in other US student scores. On the Family Report, growth is calculated from official RIT scores within the preferred growth comparison period. If a student does not have two official RIT scores within a valid growth comparison period, no growth data will be shown. For more information about valid growth comparison periods, see Which grades, subjects, and terms have status norms and growth norms?. |
| Projections |
A prediction of how a student is expected to perform. The Family Report displays projections for state and college readiness based on selections in the batch printing process. Note: Projections are only displayed if you have reportable test data in the current academic year. |
Whole Class Summary
The Whole Class Summary PDF includes a cover sheet detailing the batch print selections and an individual Family Report for each student. This format is most helpful for educators looking for a single file to print several students at once.
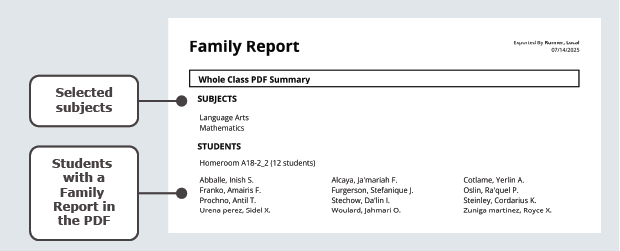
Cover sheet for the Whole Class PDF Summary
Excluded Students Summary
The Excluded Students Summary PDF lists students from the batch print selections who do not have a Family Report. Students are excluded if they do not have an official RIT score for the current or previous two terms for any of the selected subjects.
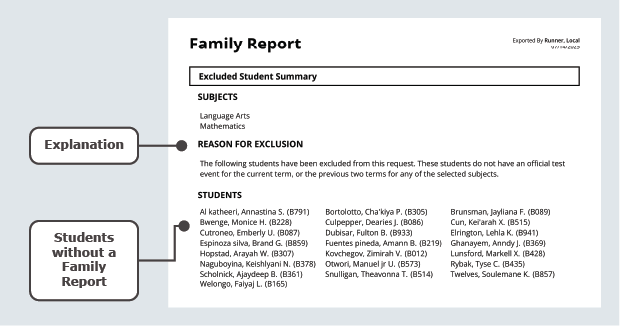
Excluded Student Summary