
More help:
NWEA Support
Have an idea?
Share it!
Progress Report
Progress Report overview
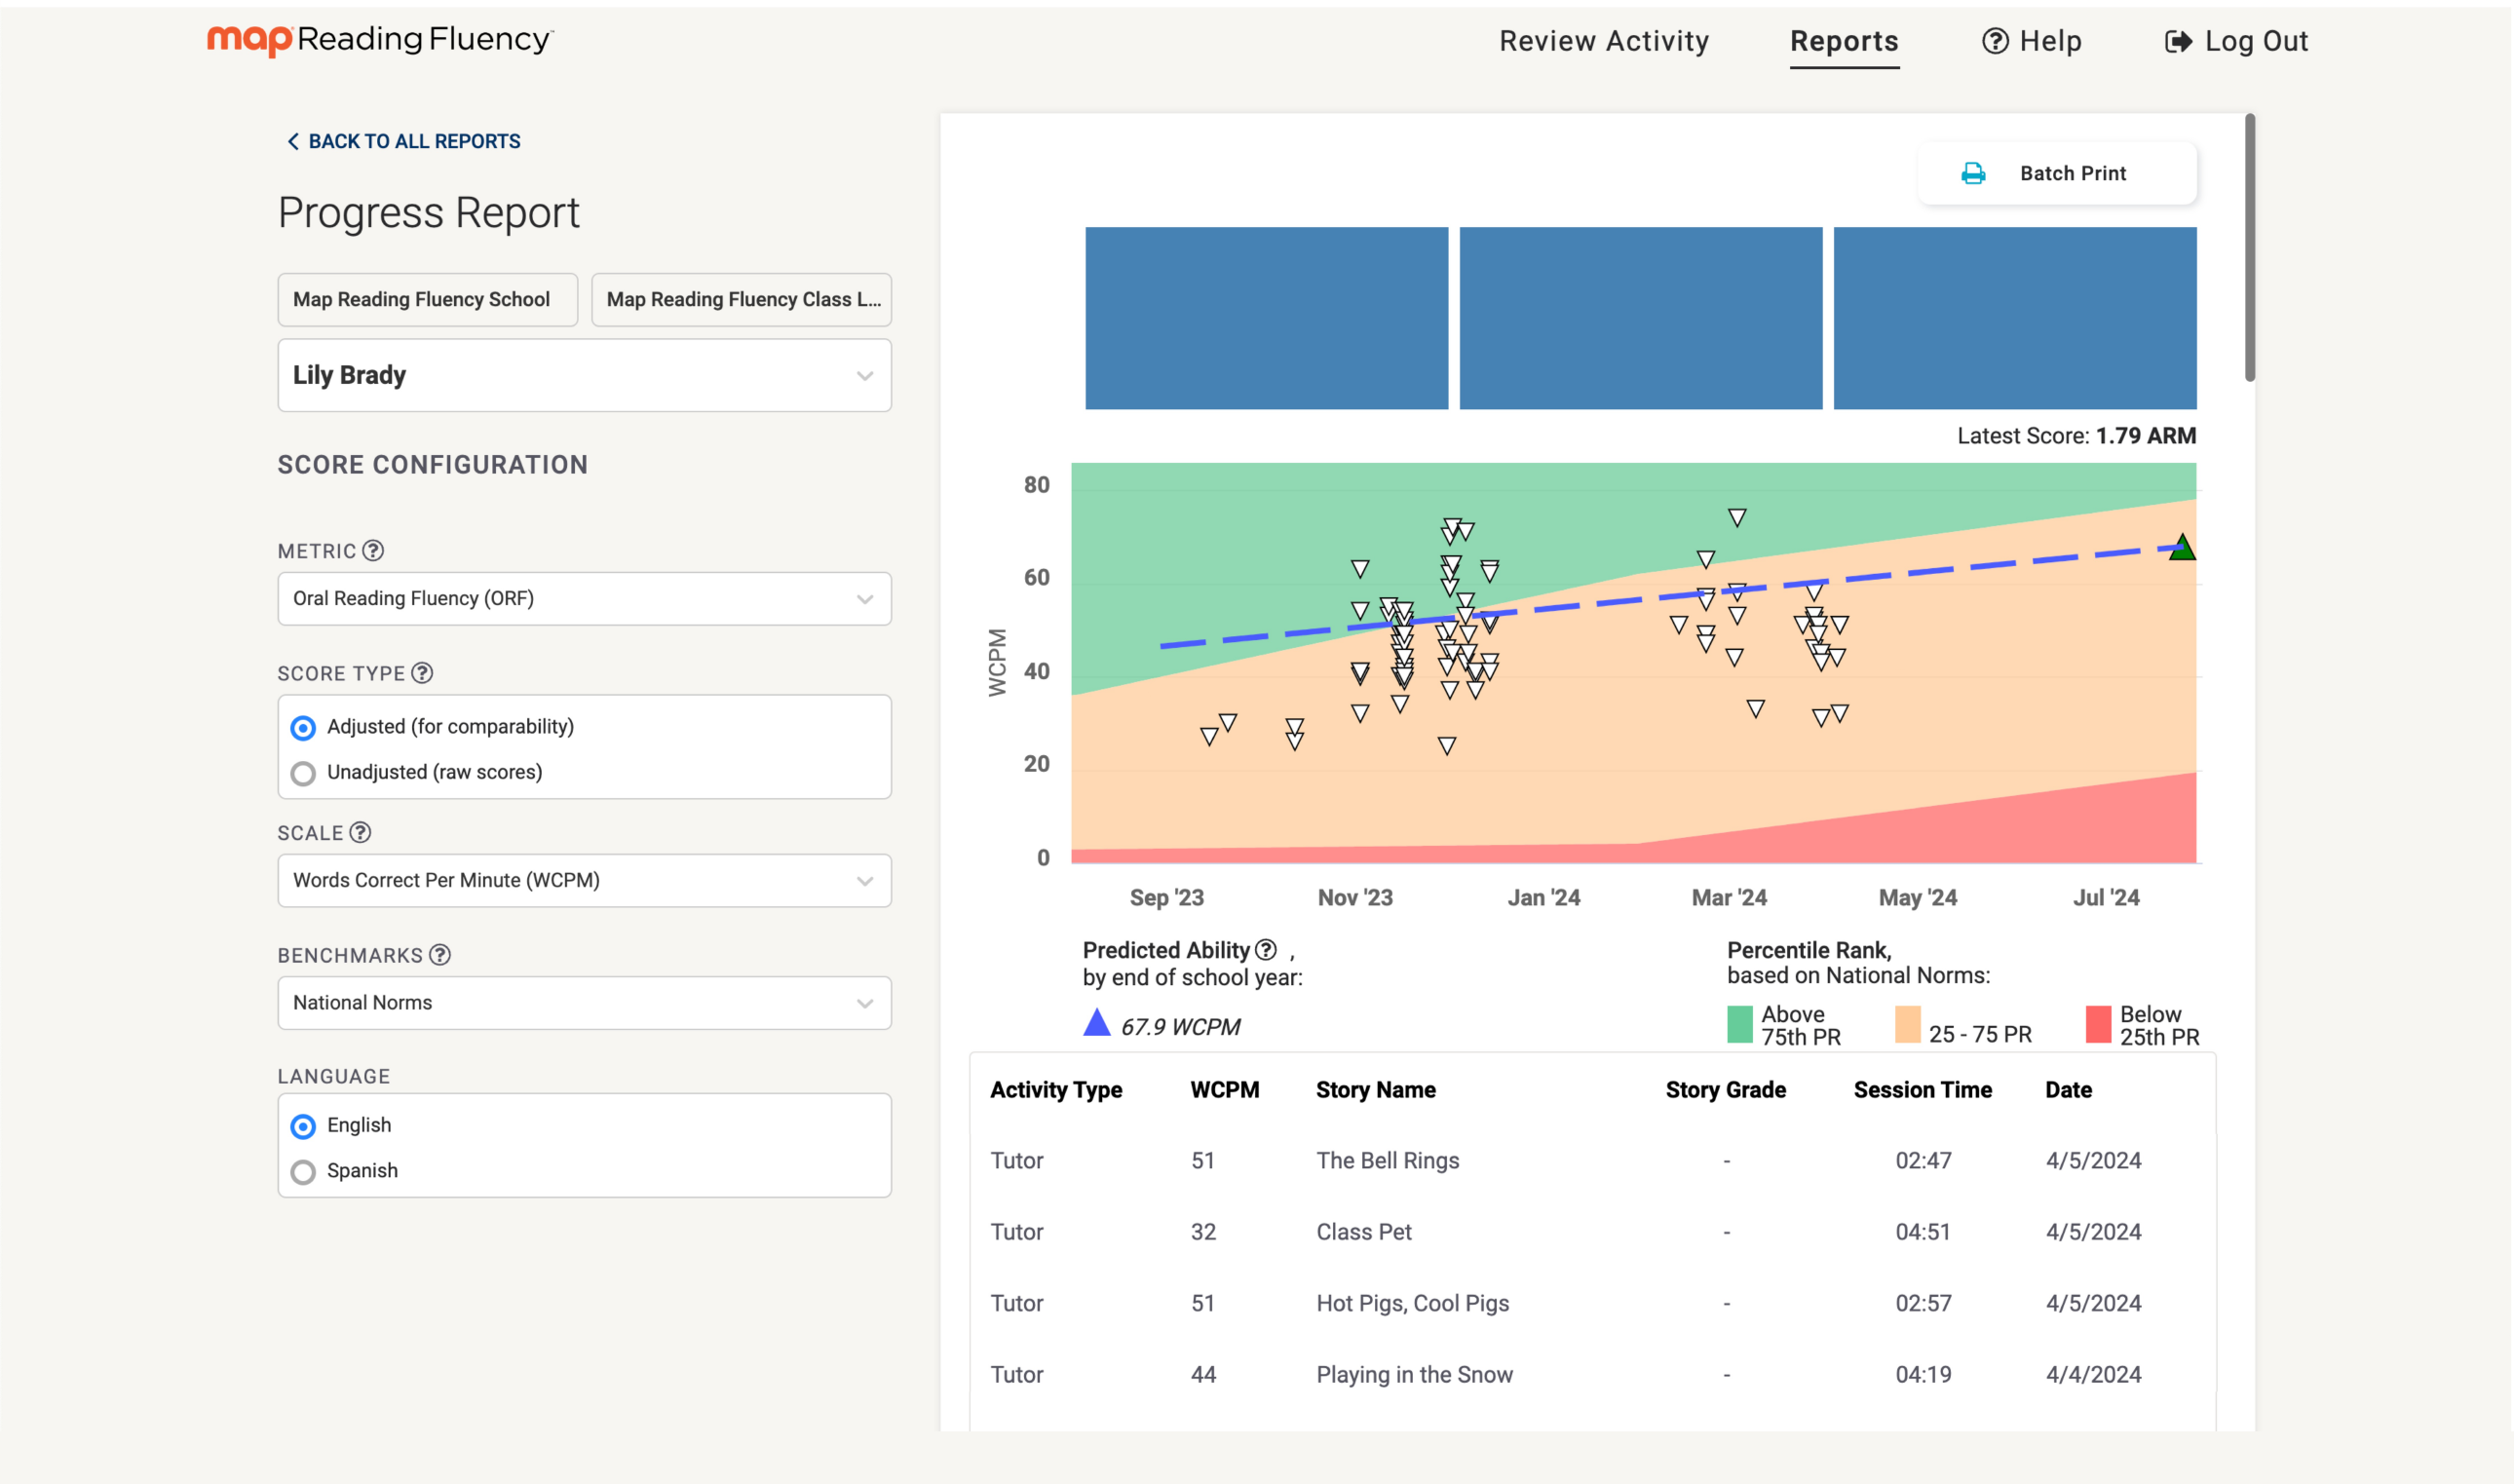
The Progress Report displays an individual student's performance over time along with a projection of expected performance tied to key metrics. The Progress Report can be used to analyze a student's reading behaviors across multiple practice sessions, track growth, and set goals.
The Progress Report
School, class, and student
If you have multiple classes, use the dropdown menu to select the one you want to view. Select a student from the dropdown menu.
Score configuration
Use the Score Configuration sidebar to change the display for different metrics, score types, scales, and benchmarking norms. When a score configuration option from the sidebar is changed, the y-axis will update the Predicted Ability (dashed blue line), the latest score information, and the display of the data.
Graph
Each symbol on the graph represents a practice session.
| Symbol | Meaning |
|---|---|
| Blue dot | Early reader Coach activity |
| White triangle | Standard Coach activity |
| Red X | Activity time of less than 30 seconds (nothing to be concerned about, just a notice to the teacher) |
| Dashed blue line | Predicted ability by end of school year |
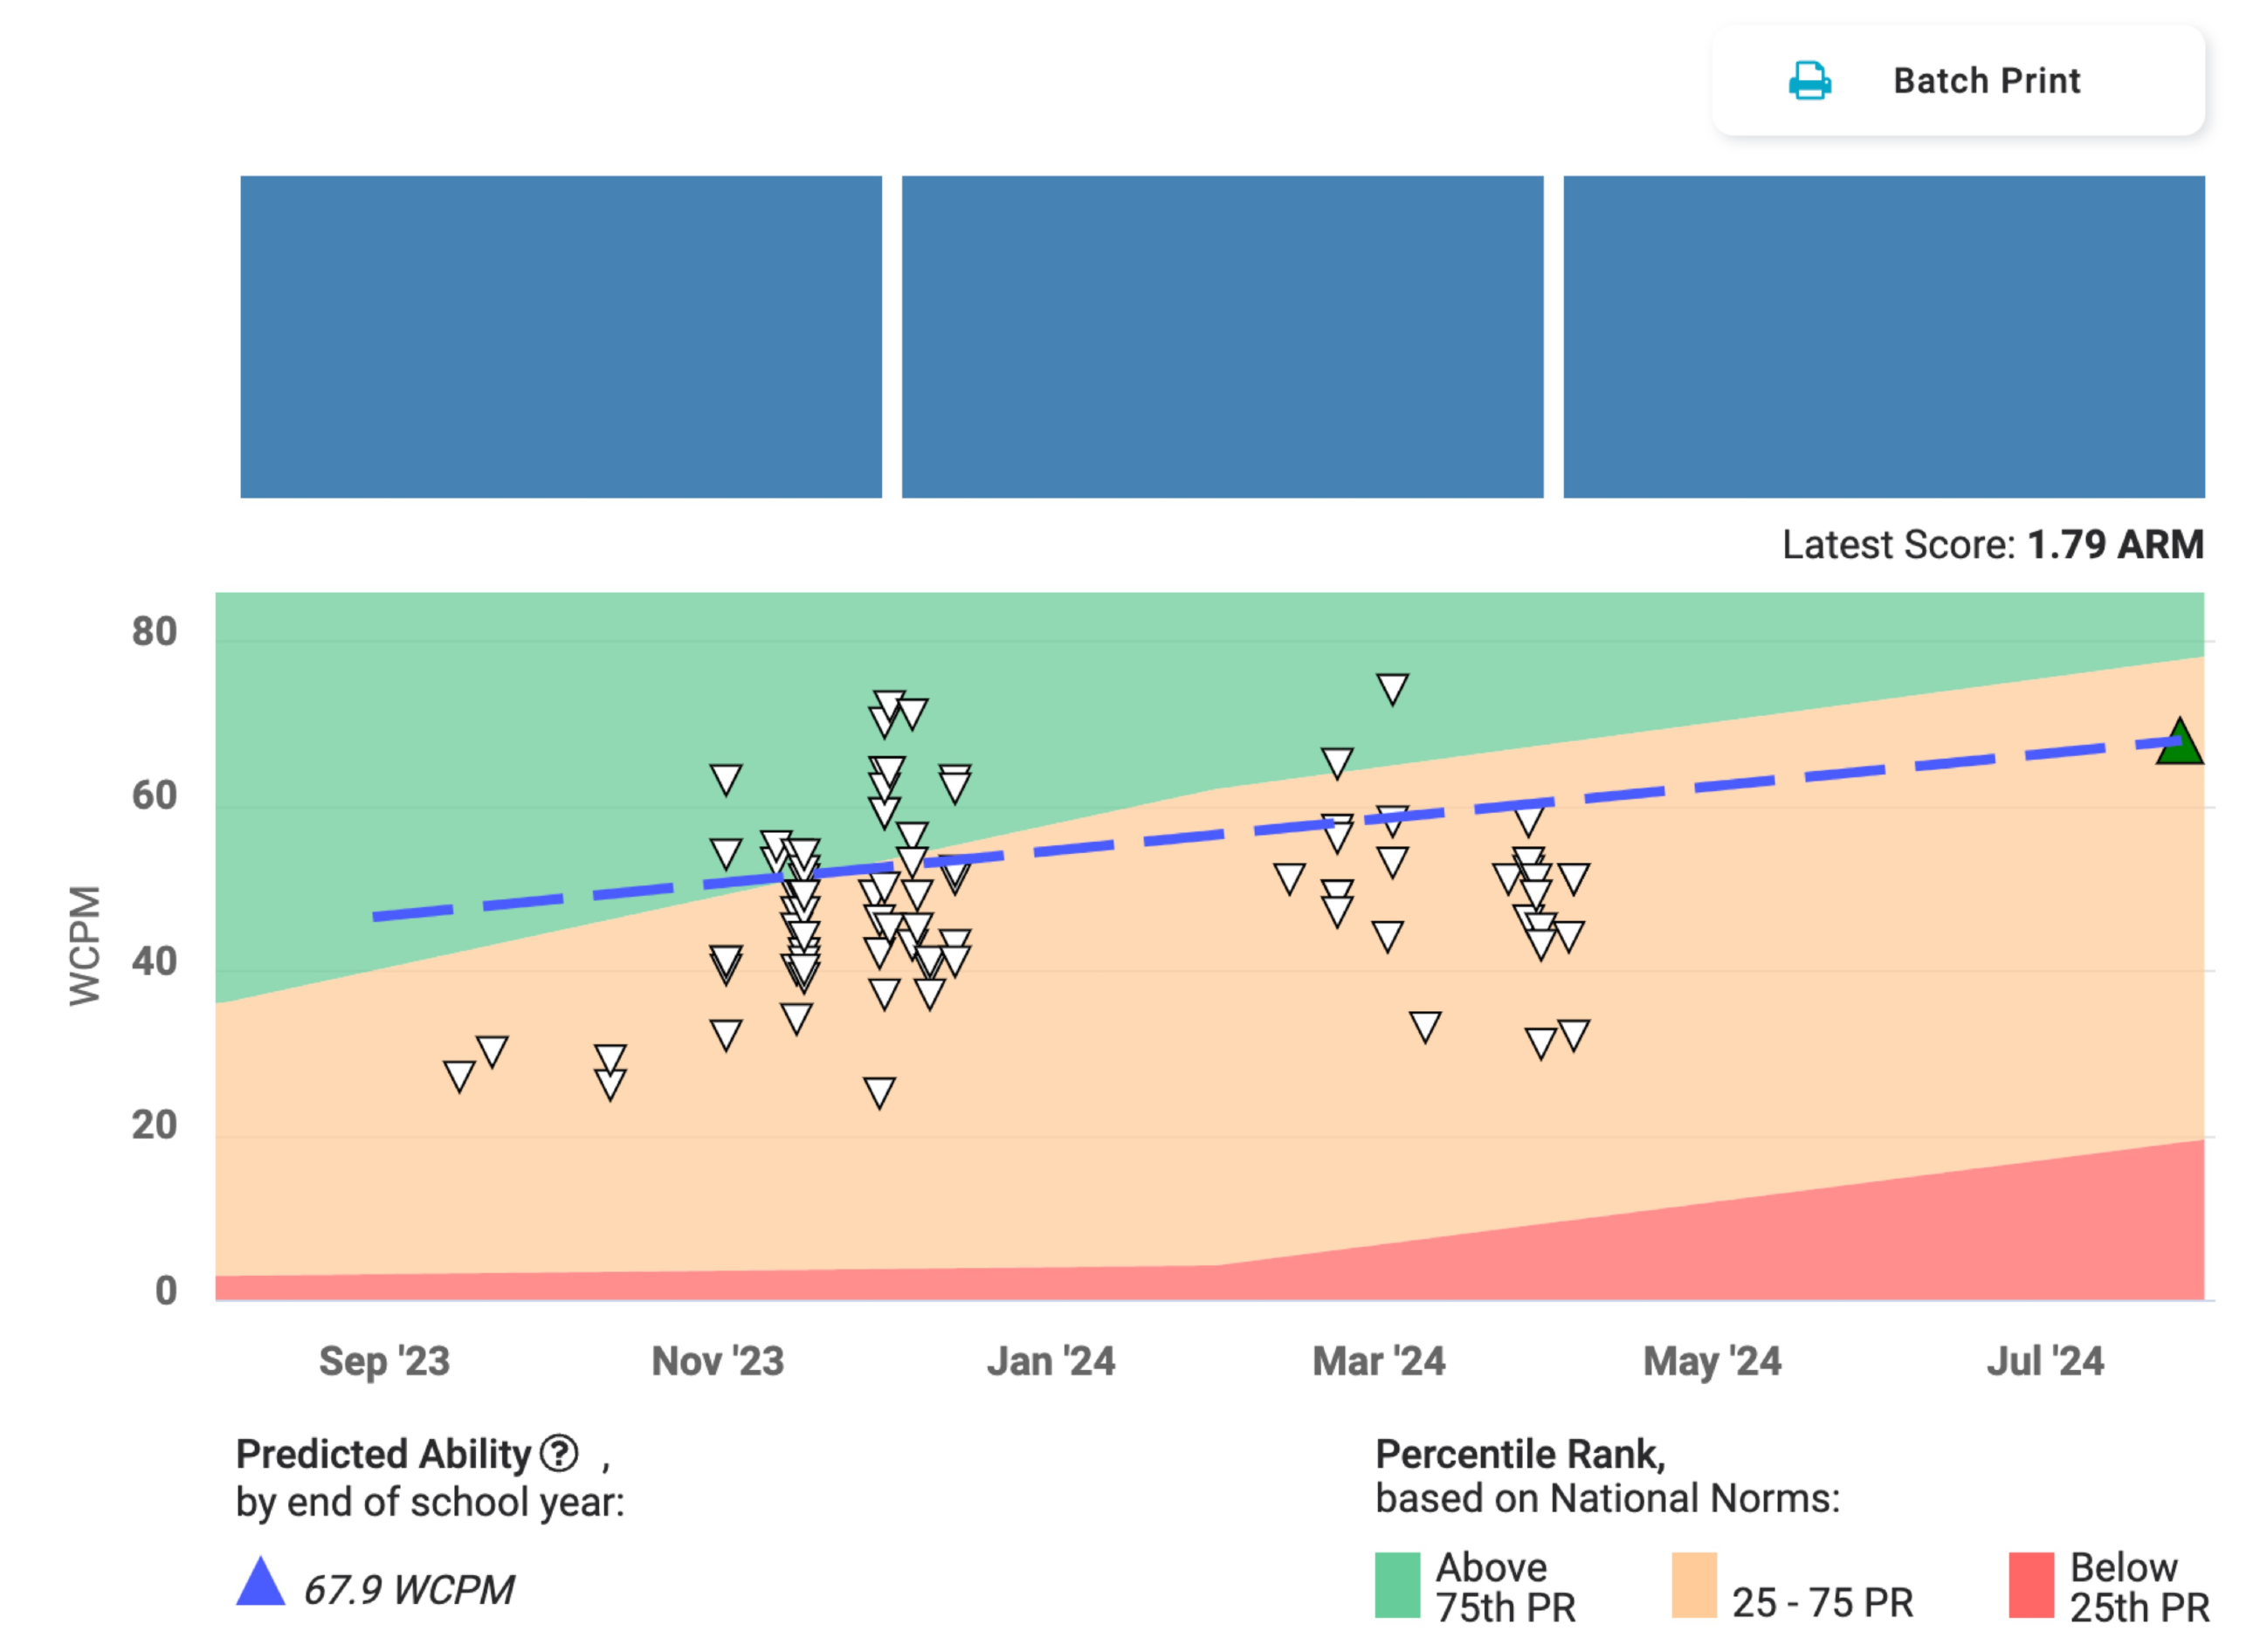
The Progress Report graph
Hover over a symbol to display additional information about a practice session. Click on the symbol to go to the Scoring Reading Activity screen.
Latest score: Amira Reading Mastery (ARM)
Above the graph, you’ll find the student’s latest Amira Reading Mastery (ARM) score. The ARM enables you to compare scores for every single student (pre-readers included), providing a basis for:
-
Comparing reading ability across students within a grade
-
Measuring an individual student’s growth
-
Placing every child in a class into instructional groups
The ARM score is focused on Adjusted WCPM for students able to read connected text and on foundational skills mastery for early readers unable to read connected text. The ARM PR shows a student's Percentile Ranking (PR) for their grade level. You can view it as similar to a Grade Level Equivalent (GLE) score.
Predicted ability
MAP Reading Fluency with Coach generates a Predicted Ability forecast below the chart to project end-of-year performance. The more data points there are, the more accurate the prediction.
The system calculates an individualized growth line for each student, starting with their initial ARM score, and then estimating growth based on norms across thousands of student sessions and the weighted average change in ARM from additional Coach sessions. Coach sessions are weighted more heavily for students with more sessions, and population-wide norms are weighted more heavily for students with fewer sessions.
If a student only completed an assessment, the system would use their initial assessment score and project weekly growth from there using population-wide growth norms for that student’s grade level, percentile rank, and time of year.
If a student completed an assessment and multiple practice sessions, the system would use their initial assessment score then project weekly growth using a combination of population-wide growth norms for the student’s grade level, percentile rank, and time of year and that student’s practice sessions. Specifically, the extent to which the growth line is influenced by norms is inversely proportional to how much data the system has for the student. The growth line shown is somewhere in between each student’s observed growth rate in Coach and what is seen in the norms.
Percentile rank
The percentile ranks are based on national norms, as displayed in the benchmark section of the Score Configuration sidebar.
Activity Details table
Below the progress graph is a table listing all activities the student has completed within the current school year, ordered from most recent to least recent. Use the Score Configuration options in the sidebar to update the metric and scale displayed in the table. Select an Activity Type (Tutor) to open the Scoring Activity screen to listen to and/or rescore a student's reading. The Progress Report shows the latest 600 activities starting from the beginning of the school year.
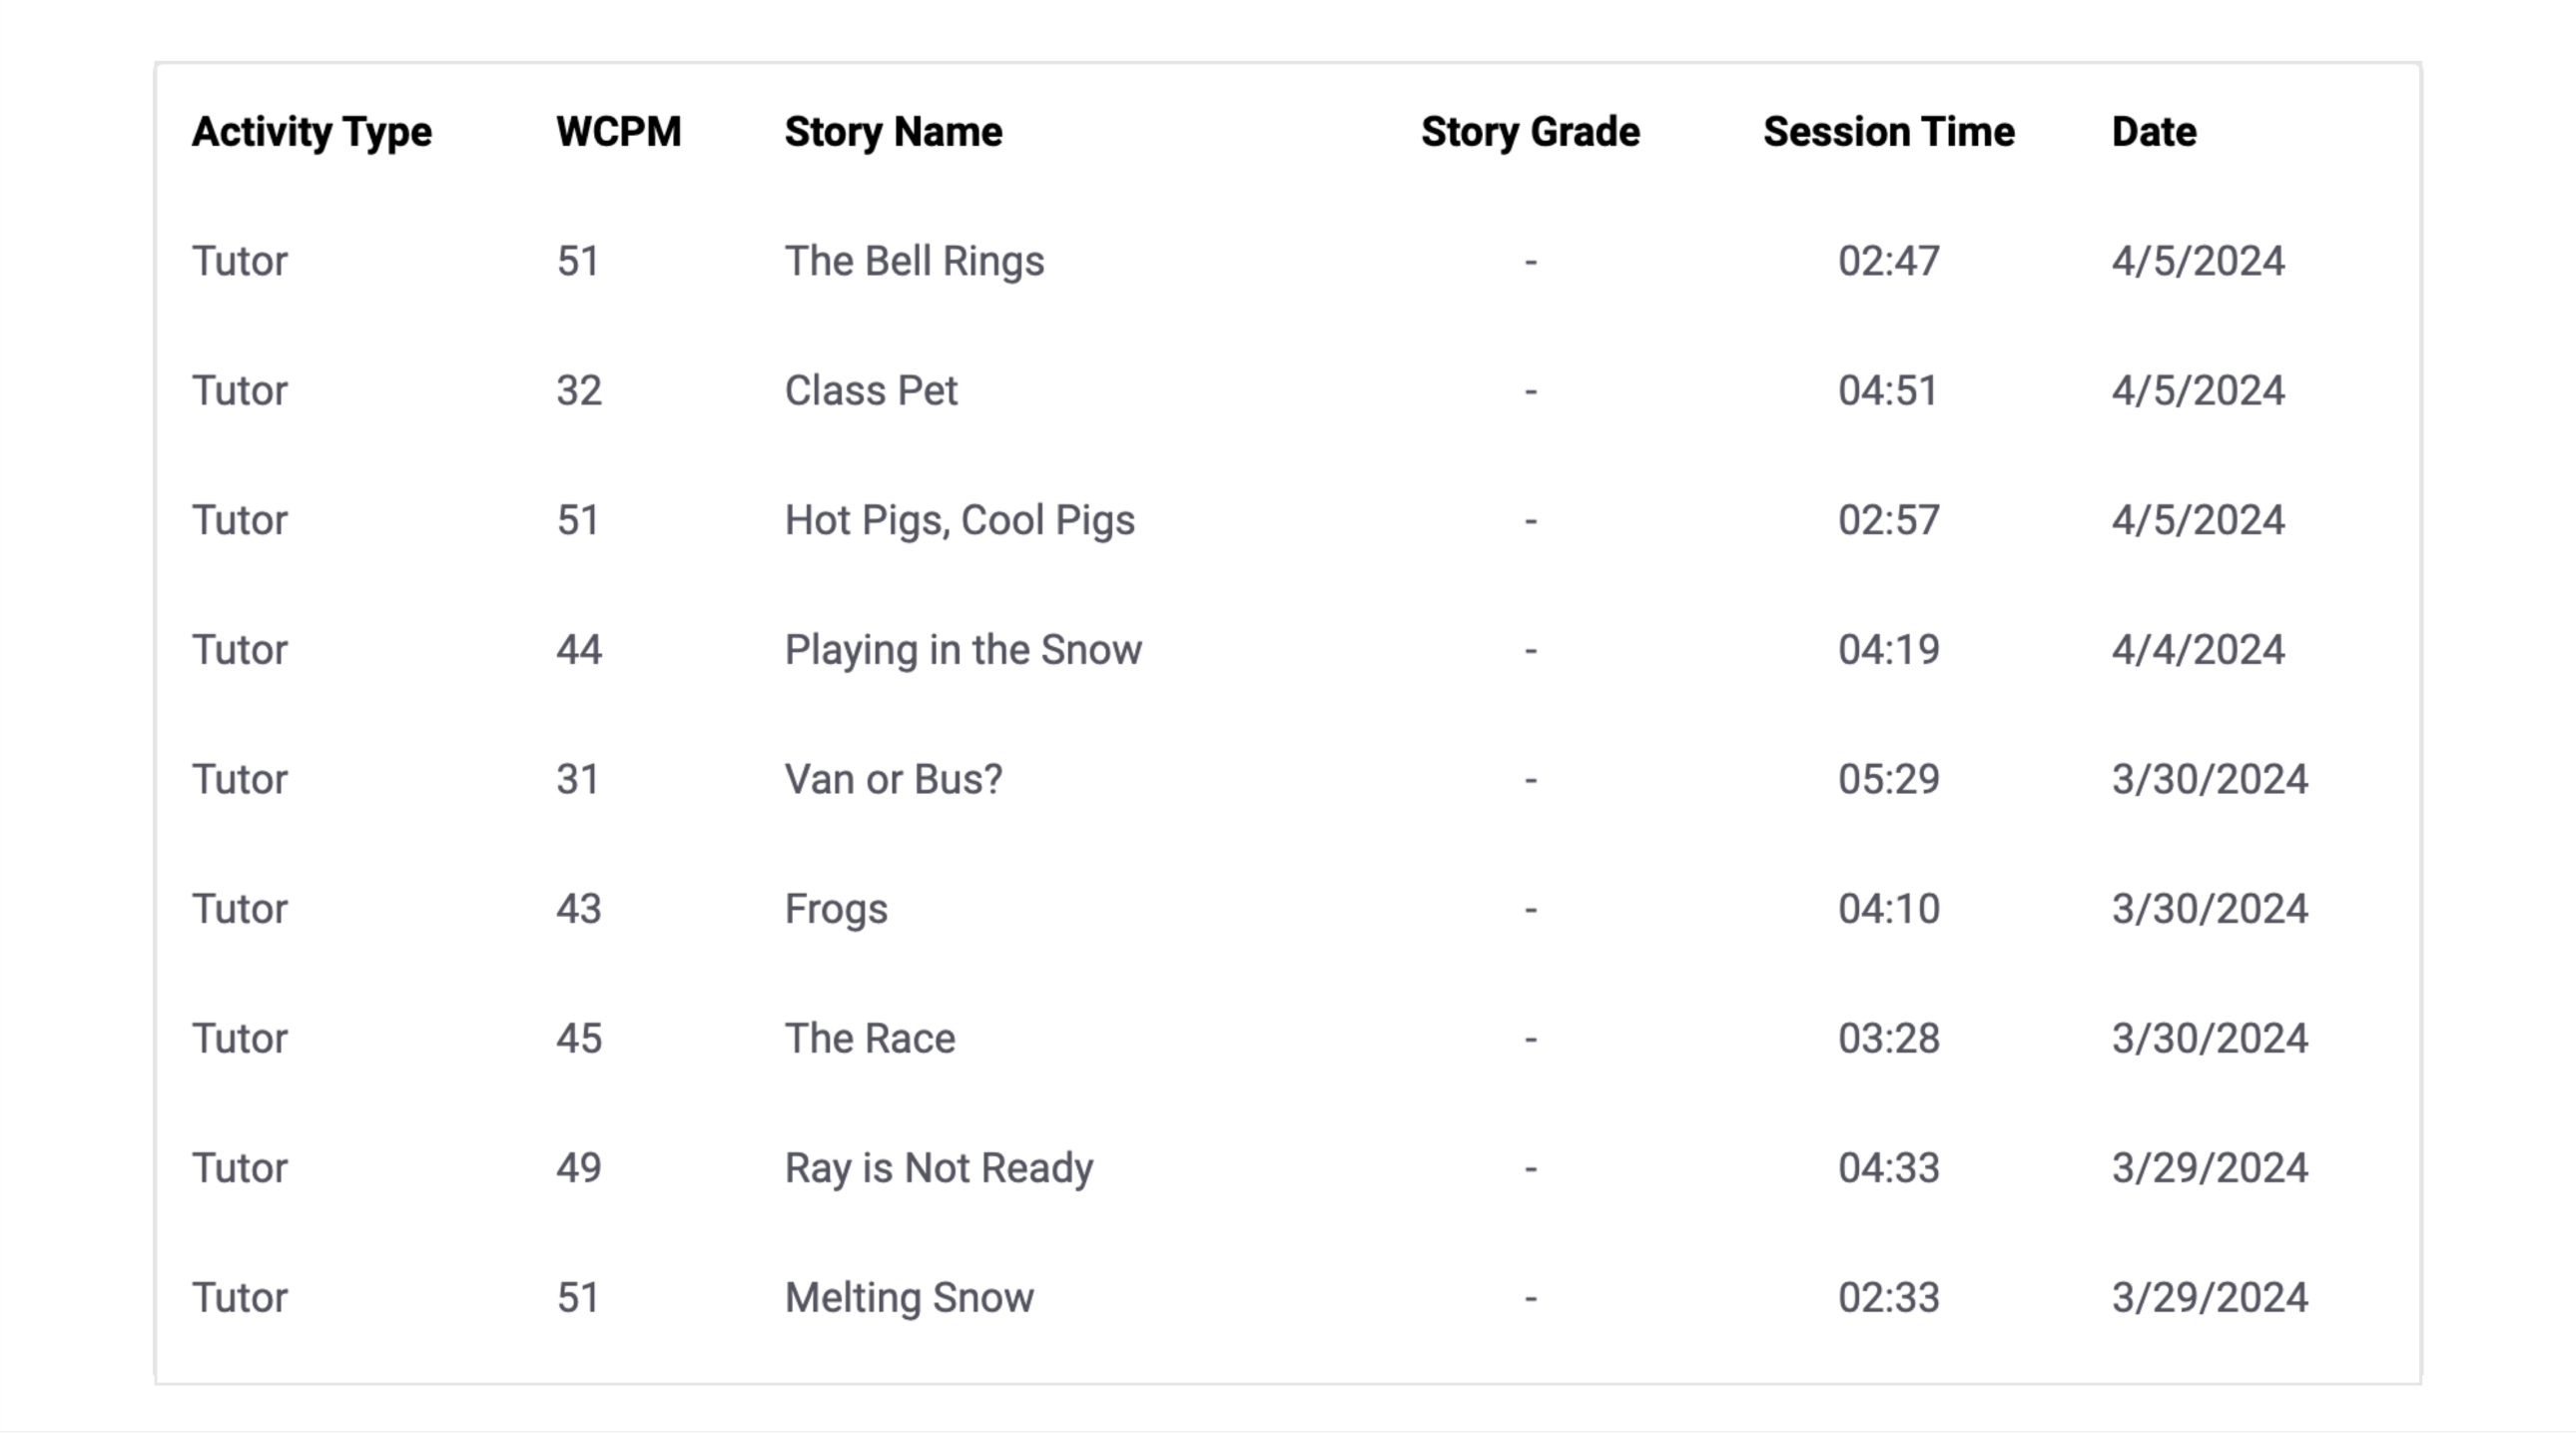
The Activity Details table
Batch print
You can batch print the Progress Report. Select Batch Print to generate a PDF with data for all the students in the class.