
More help:
NWEA Support
Have an idea?
Share it!
Benchmark Matrix Report
| Description | The Benchmark Matrix report includes scores and grade-level expectations from foundational skills, Sentence Reading Fluency, and oral reading measures as well as easy access to detailed Individual Student Reports. |
| Intended audience | Instructors, School Administrators |
| Required role | Instructor, School Administrator |
To review class-level Benchmark test results, use the Benchmark Matrix report. This report includes:
-
Scores and grade-level expectations from Foundational Skills, Sentence Reading Fluency, and Oral Reading Measures
-
Easy access to detailed Individual Student reports
Reviewing Benchmark test results
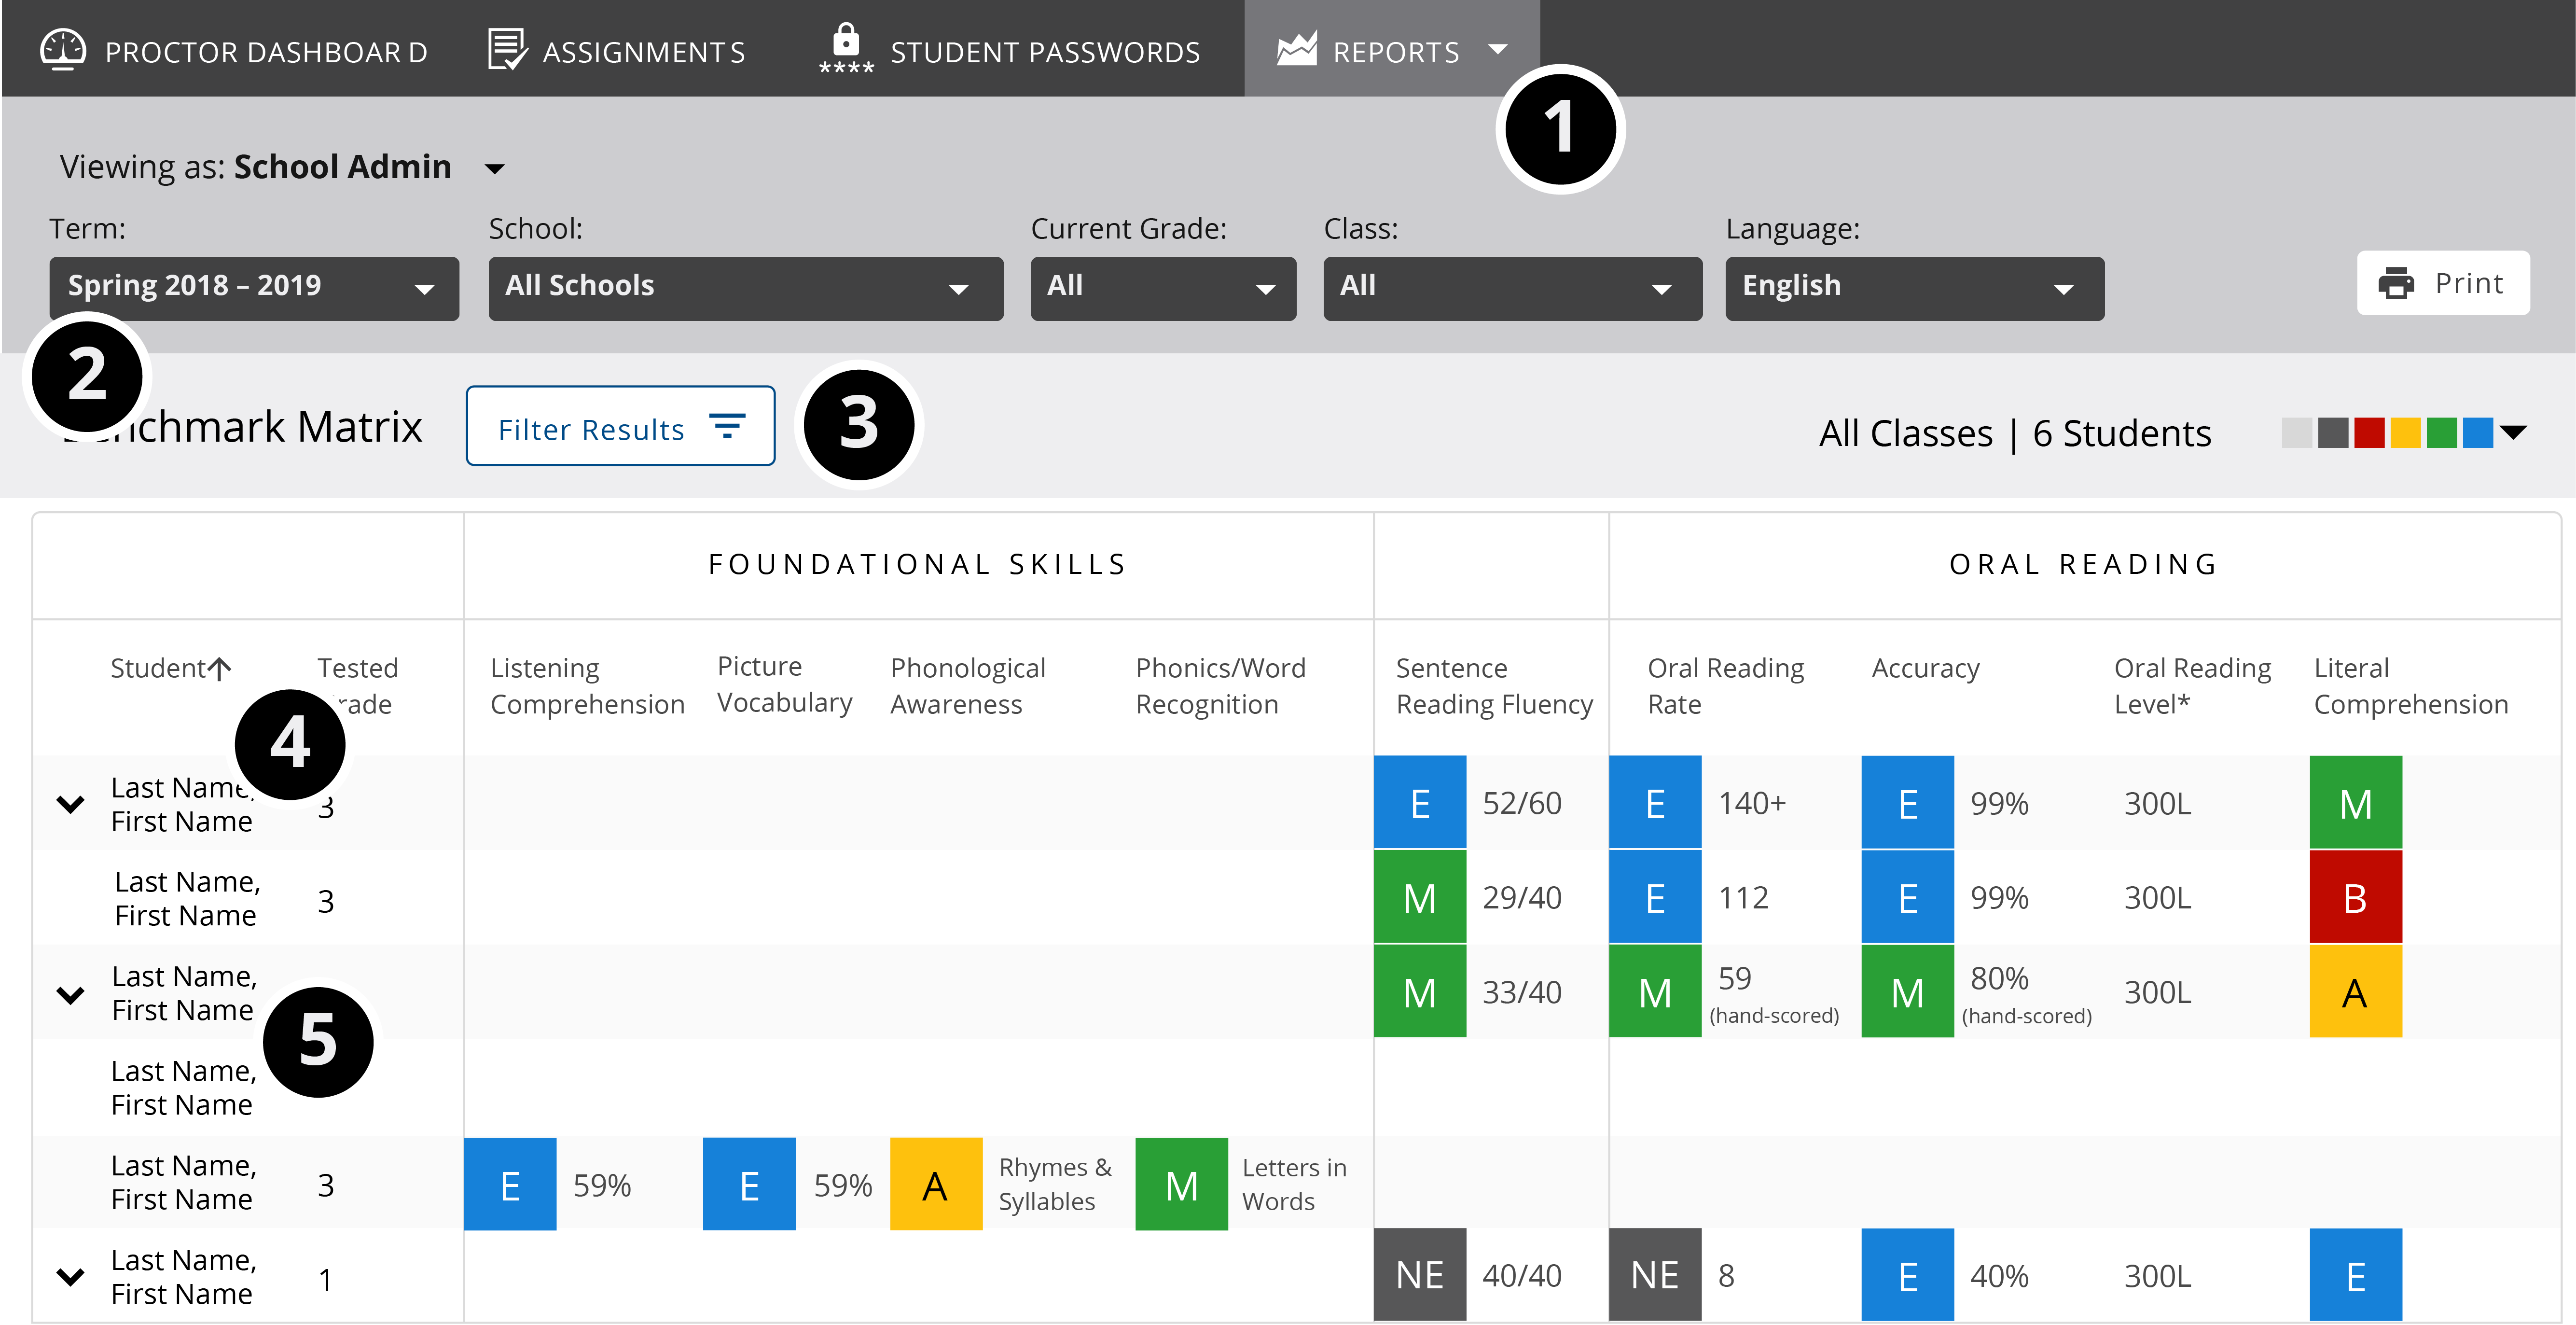
This annotated graphic and corresponding numbered steps will guide you through the key features of the Benchmark Matrix report.
-
In MAP Reading Fluency, select REPORTS on the dark gray menu bar toward the top of the screen, then choose Benchmark Matrix from the drop-down menu.
-
To access data from a specific Term, School, Grade, Class, or Language, adjust the high-level filters as needed.
-
To only show students with results, or to show multiple test results per term, select the Filter Results button.
Tip: The default Benchmark Matrix view only displays results from the most recent test each student has taken within a selected term. If your students have taken multiple tests within a term and you’d like the Benchmark Matrix to include all of the results, activate the Show multiple test results per term slider within the Filter Results button dialog.
-
To sort the data, select the appropriate column header for your needs. This can be a helpful way to start surfacing patterns that may inform how you create small instructional groups in your class.
-
To access more detailed individual student results, select a student’s name. This will open their Individual Student Report.
Performance levels: grade-level expectations
All reports use the following color indicators and associated letters to relate student performance to grade-level expectations:
■ Blue: Exceeds grade-level expectations
■ Green: Meets grade-level expectations
■ Yellow: Approaches grade-level expectations
■ Red: Below grade-level expectations
■ Gray: NS No score
■ Dark Gray: NE No grade-level expectations
No Score (NS)
No Score may appear on a student’s report when an insufficient amount of data has been collected to determine a score. This only applies to activities that include oral reading. To learn more, refer to No Score (NS) for Oral Reading.
No grade-level expectations (NE)
The No Expectation performance level may appear in reports for some pre-K, kindergarten, and first-grade students. This level, denoted as NE, will be used where there is no applicable grade-level expectation. For example, if a beginning kindergartener makes it to the Word Reading subtest (which is not expected of a kindergarten student), then gets 2 of 10 questions correct, NE will be reported.
Interpretive tables
To learn more about grade level expectations and zones of proximal development levels, refer to Interpretive Tables .