
More help:
NWEA Support
Have an idea?
Share it!
–See Other School or District Level Reports–
| Description |
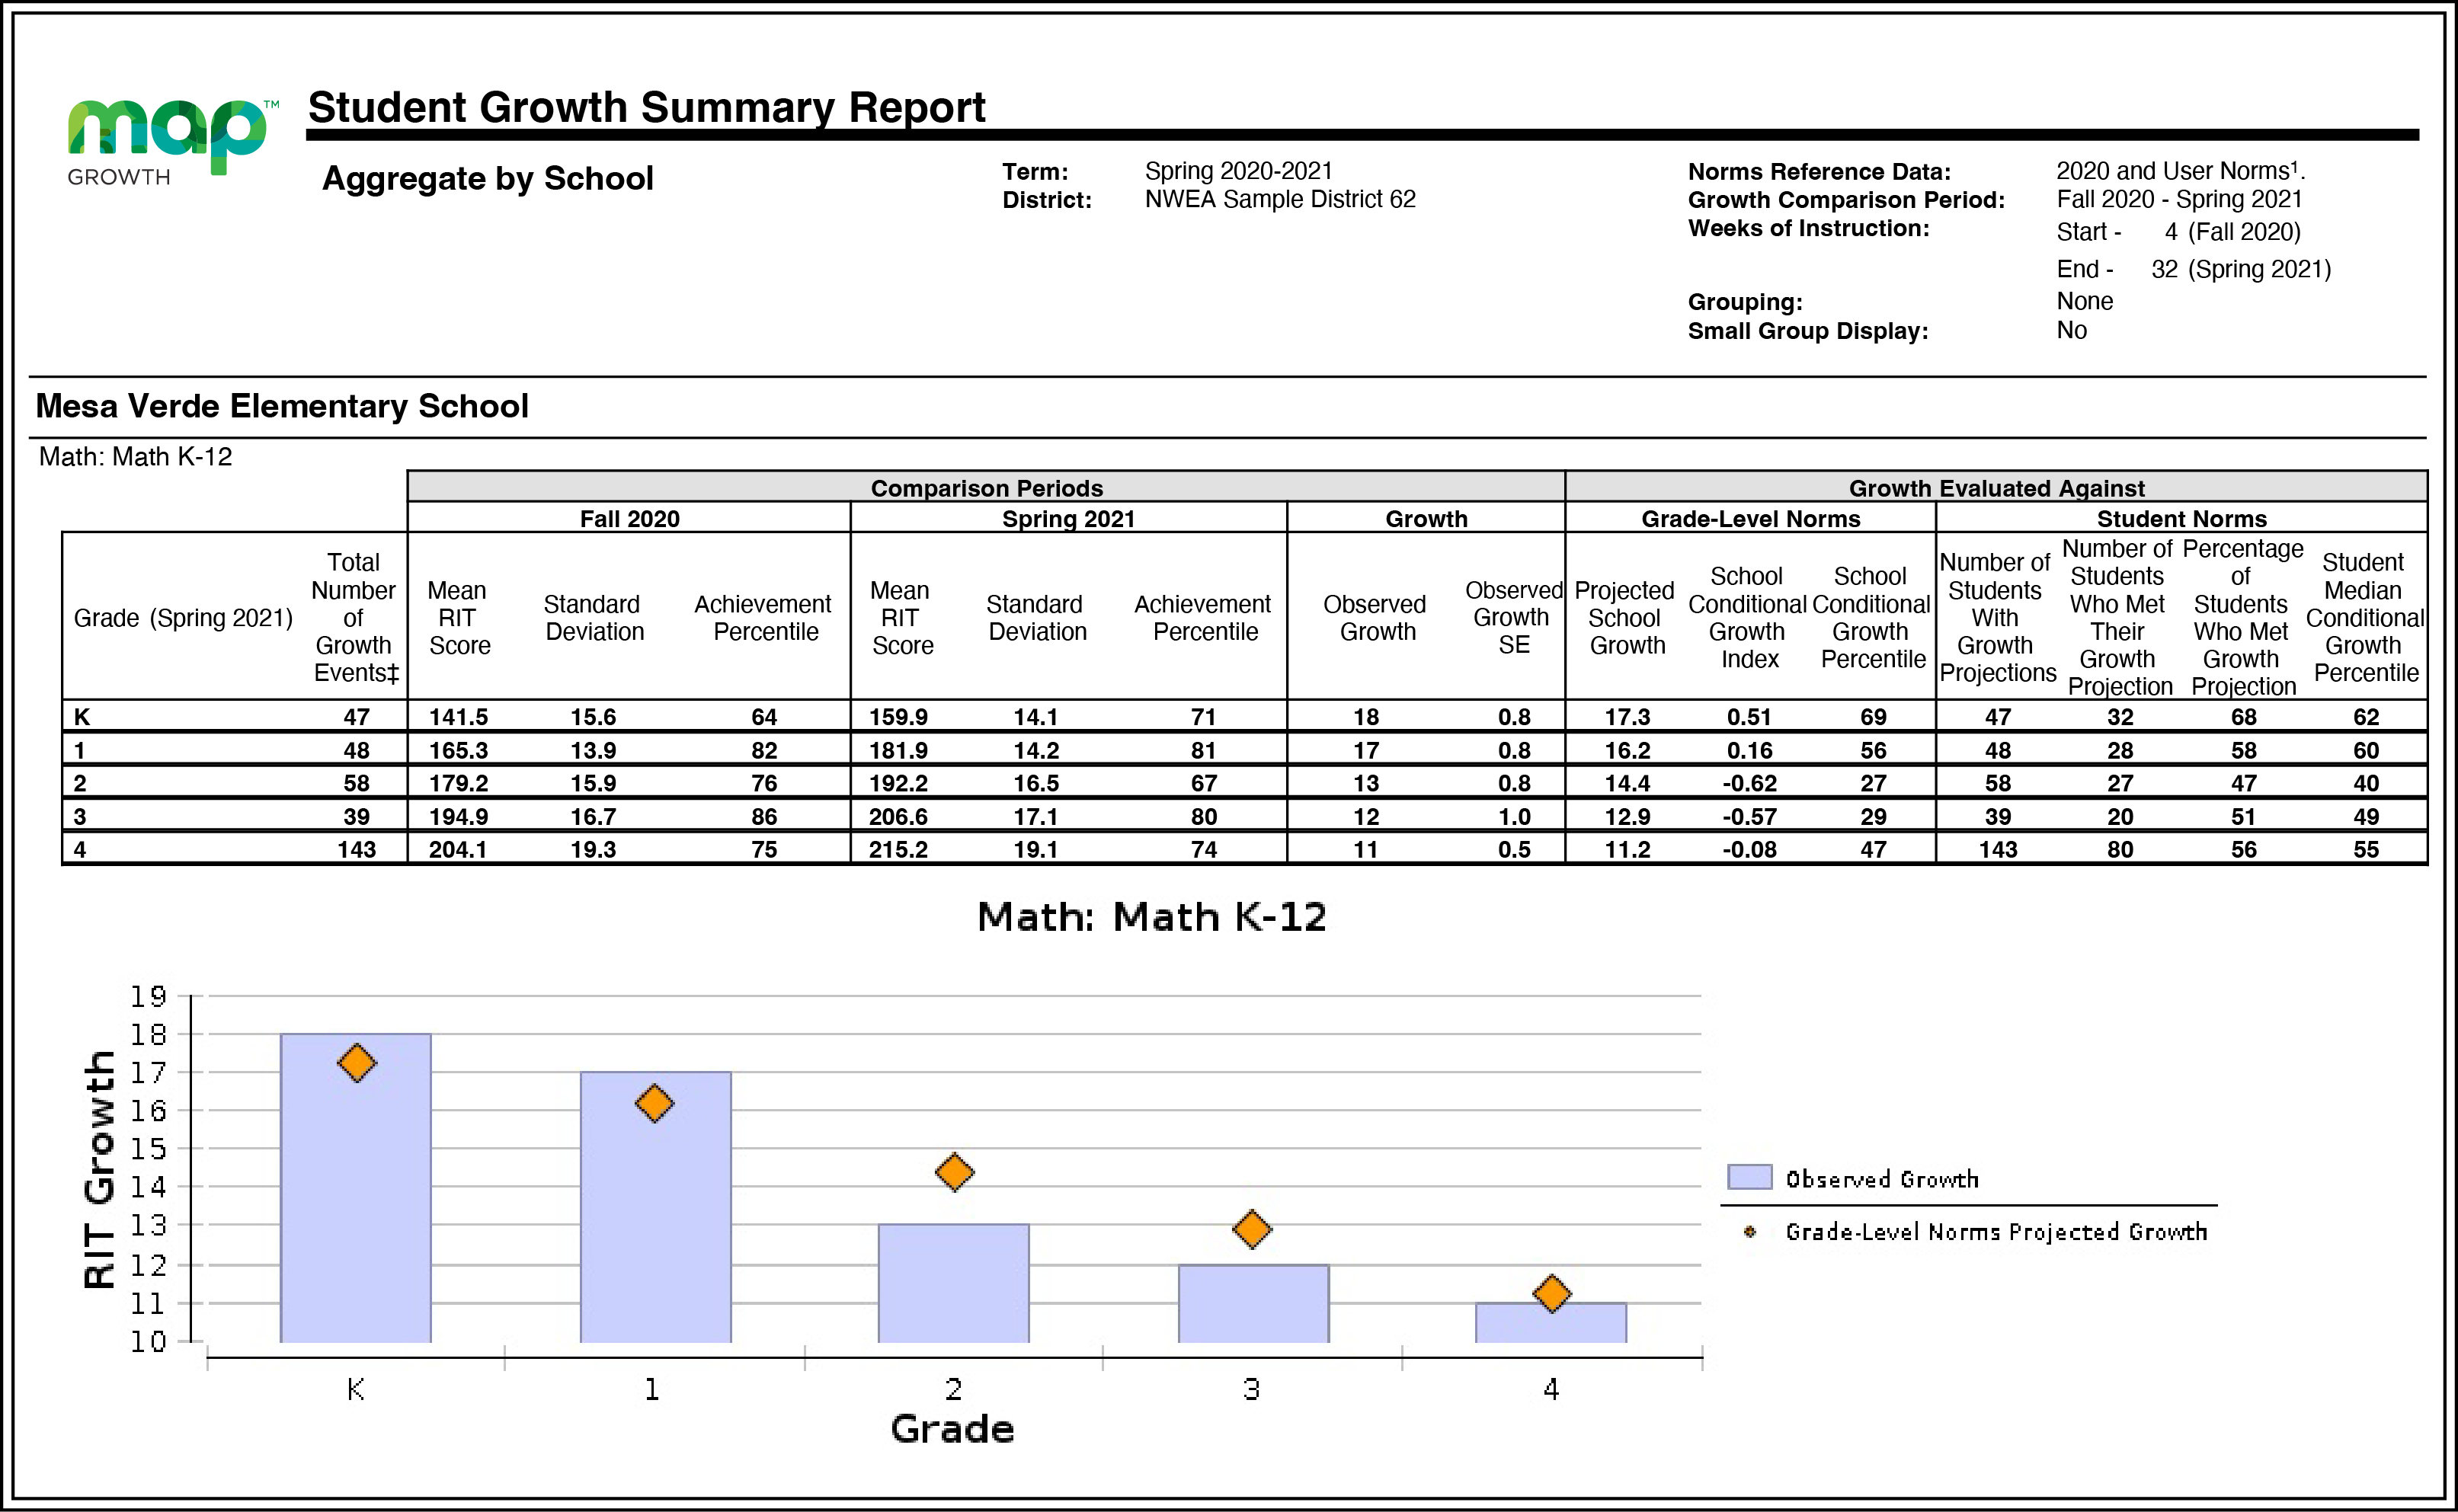
Shows aggregate growth in a district or school compared to the norms for similar schools, so you can adjust instruction and use of materials. |
| Applicable Tests | MAP Growth and MAP Growth K–2 |
|
Required Roles |
Administrator or Assessment Coordinator (School or District) |
|
Date Limits |
All years prior, for tests completed within your test window range (set under Manage Terms). Also, the Test Window Complete checkbox must be selected. |
| Notes |
|
Video Overview
Note: Elements of the Student Growth Summary report have been updated, and your reports may not exactly match the reports featured in this video.
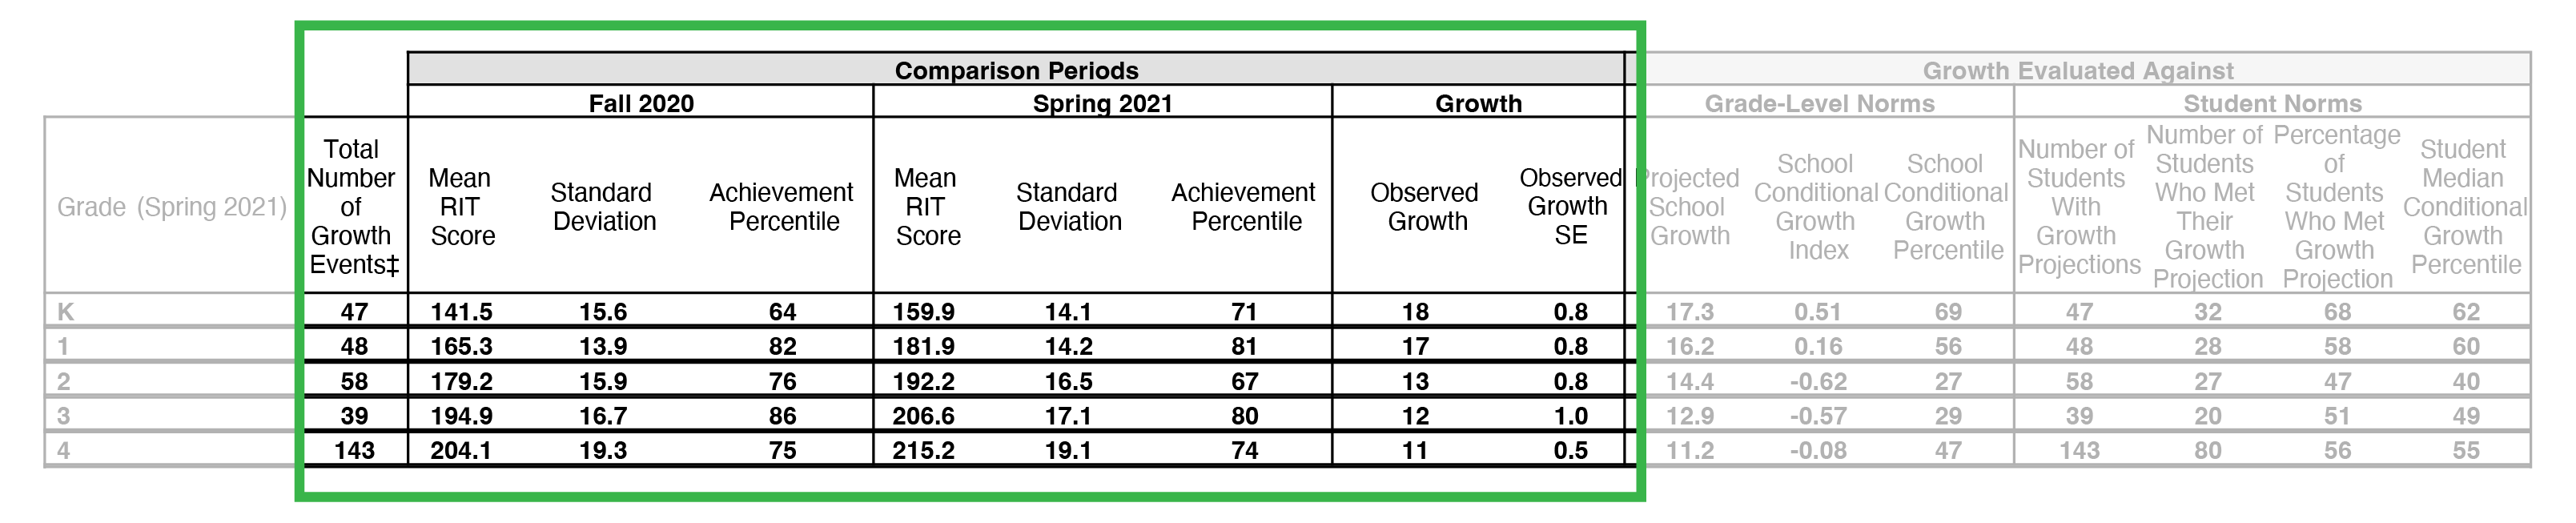
Comparison Periods
|
| Total Number of Growth Events | Mean RIT Score |
Standard Deviation | Achievement Percentile | Observed Growth |
Observed Growth SE |
|---|---|---|---|---|---|
| Number of students with valid growth test events for both terms. | Average RIT score of students in this Growth Count for the term indicated. | Indicates academic diversity of a group of students. The lower the number, the more students are alike (zero would mean all scores are the same). The higher the number, the greater the academic diversity in this group. |
Percentile (a percentage-based ranking) of the achievement reached for the given term, as compared to the school-level NWEA norms from the same grade and with the same weeks of instruction between testing (as specified in your MAP preferences). |
Average change in RIT scores from starting term to ending term (ending RIT minus starting RIT). | Growth standard error (SE) associated with term-to-term growth for the group. If these students tested again over the same period with comparable tests, term-to-term growth would fall within a range defined by the observed growth, plus or minus the growth sampling error, about 68% of the time. |
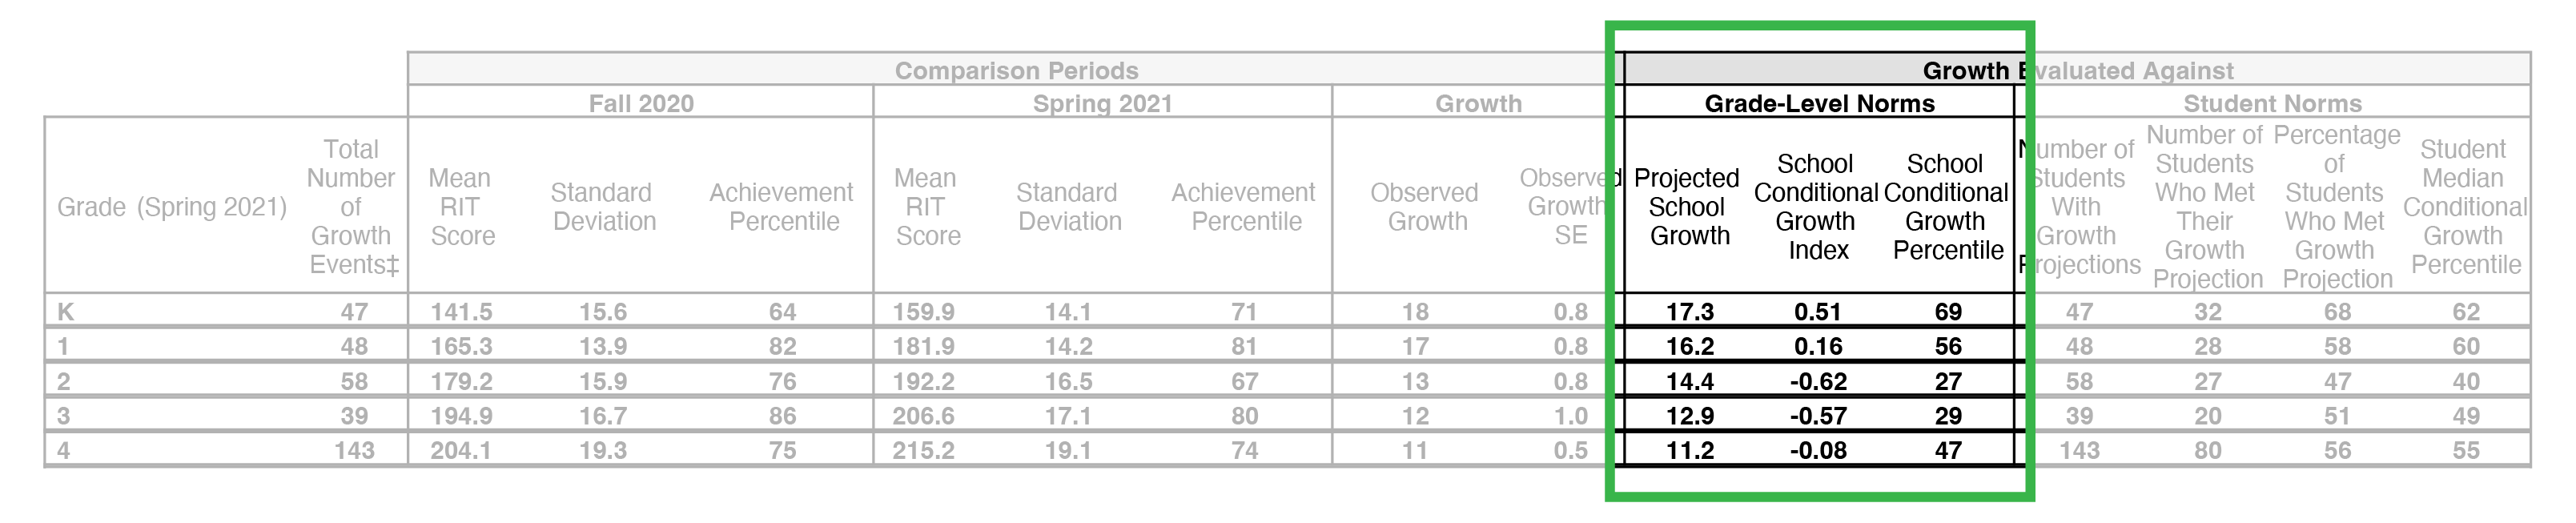
Grade-Level Norms Section
|
| Grade-Level Norms | ||
|---|---|---|
| Projected School Growth | School Conditional Growth Index | School Conditional Growth Percentile |
|
Growth projections based upon the mean RIT of this group and the 2020 school-level norms. It also incorporates the weeks of instruction before testing, as set in the MAP preferences for your district or school. |
Enables you to compare growth between grades or groups by putting them all on an equal scale. This measurement ranks your grade-level growth among the growth observed across all matching schools within the NWEA norms study. A value of zero (0) corresponds to the mean (typical) growth, indicating that growth exactly matched projections. For more information: Growth Insights |
Translates the School Conditional Growth Index to percentile (a percentage-based ranking). An index of 0 equates to 50th percentile. |
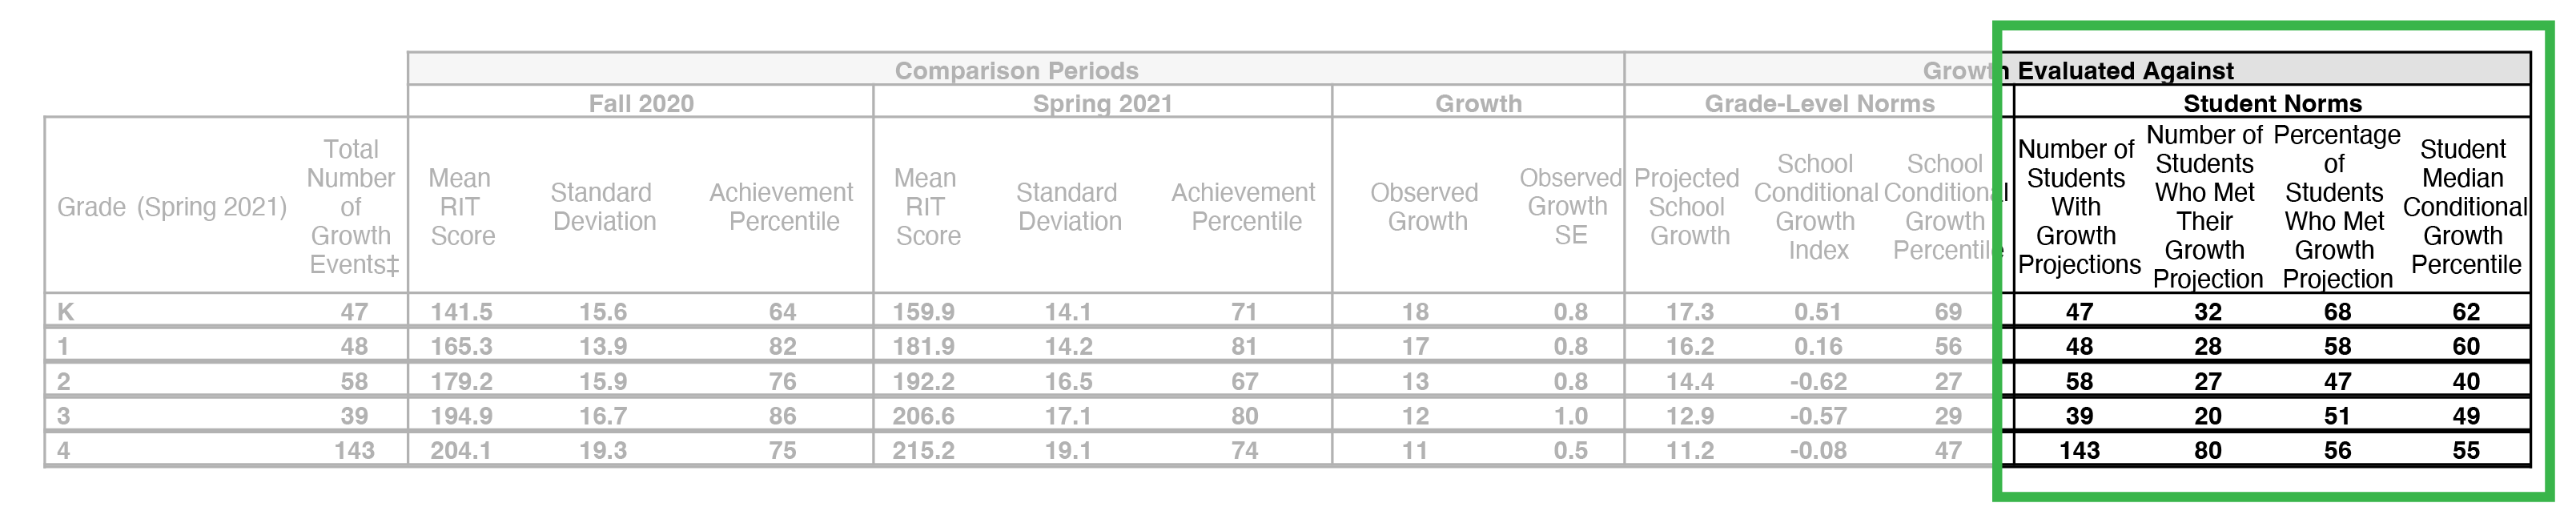
Student Norms Section
|
| Student Norms | |||
|---|---|---|---|
| Number of Students with Growth Projections | Number of Students Who Met Their Growth Projection | Percentage of Students Who Met Growth Projection | Student Median Conditional Growth Percentile |
| Number of students used for the Student Norms calculations. Because growth projection norms are not available for some situations, this count could be smaller than the first Count column. |
Shows how many students collectively met or exceeded their individual growth projections. Intended for evaluating the growth within each grade, but not for comparing grades. |
Percentile that falls in the middle of all the Conditional Growth Percentiles for this group of students. It shows how these students compare to matching peers from NWEA norms. The student norms percentile is often larger than the school norms percentile, because individual students’ growth rates are typically larger than a grade can grow as a whole. For more on student conditional growth, see: Summary Growth Sample . |
|
Report Options
Term: The season and academic year that will become the end term in the comparison. Summer is not available for comparison.
Aggregation: Determines the level of data aggregation for the report.
- By District summarizes test event data for all schools in the district.
- By School summarizes test event data by school.
Note: The option to aggregate by district is only available to Assessment Coordinators. Administrators can only order a Student Growth Summary Report that contains data for schools with which they are associated.
School: List of schools in your district (available when aggregation By School is selected). Includes selected schools in the report.
Note: Schools are associated with a selected term. If you choose a different term, the list of available schools may change.
Optional Grouping: Organizes and calculates results by gender, ethnicity, or program. This grouping is coupled with the aggregation chosen in the options above.
Growth Comparison Period: Comparison terms available, based on the Term chosen above.
Note: If you choose a comparison across academic years (like fall-to-fall), then the ending term will reflect the current grade, and the starting term will reflect results for the same group of students in the prior year.
Small Group Display: Overrides the report summary default and reports summary data for groups of fewer than ten students with growth test scores. Because summary data for small groups is not statistically reliable, it is typically not included in reports.