
More help:
NWEA Support
Have an idea?
Share it!
Welcome to the Class Profile report! You can use this report to access streamlined information about your class and your students’ testing status, slice data to make informed instructional decisions, and understand the strength and opportunity areas that can serve as a starting point for formative classroom practices and flexible learning groups.
Contents
Getting started
In this introduction you'll learn what the Class Profile offers you and how you can access it.
Feature overview
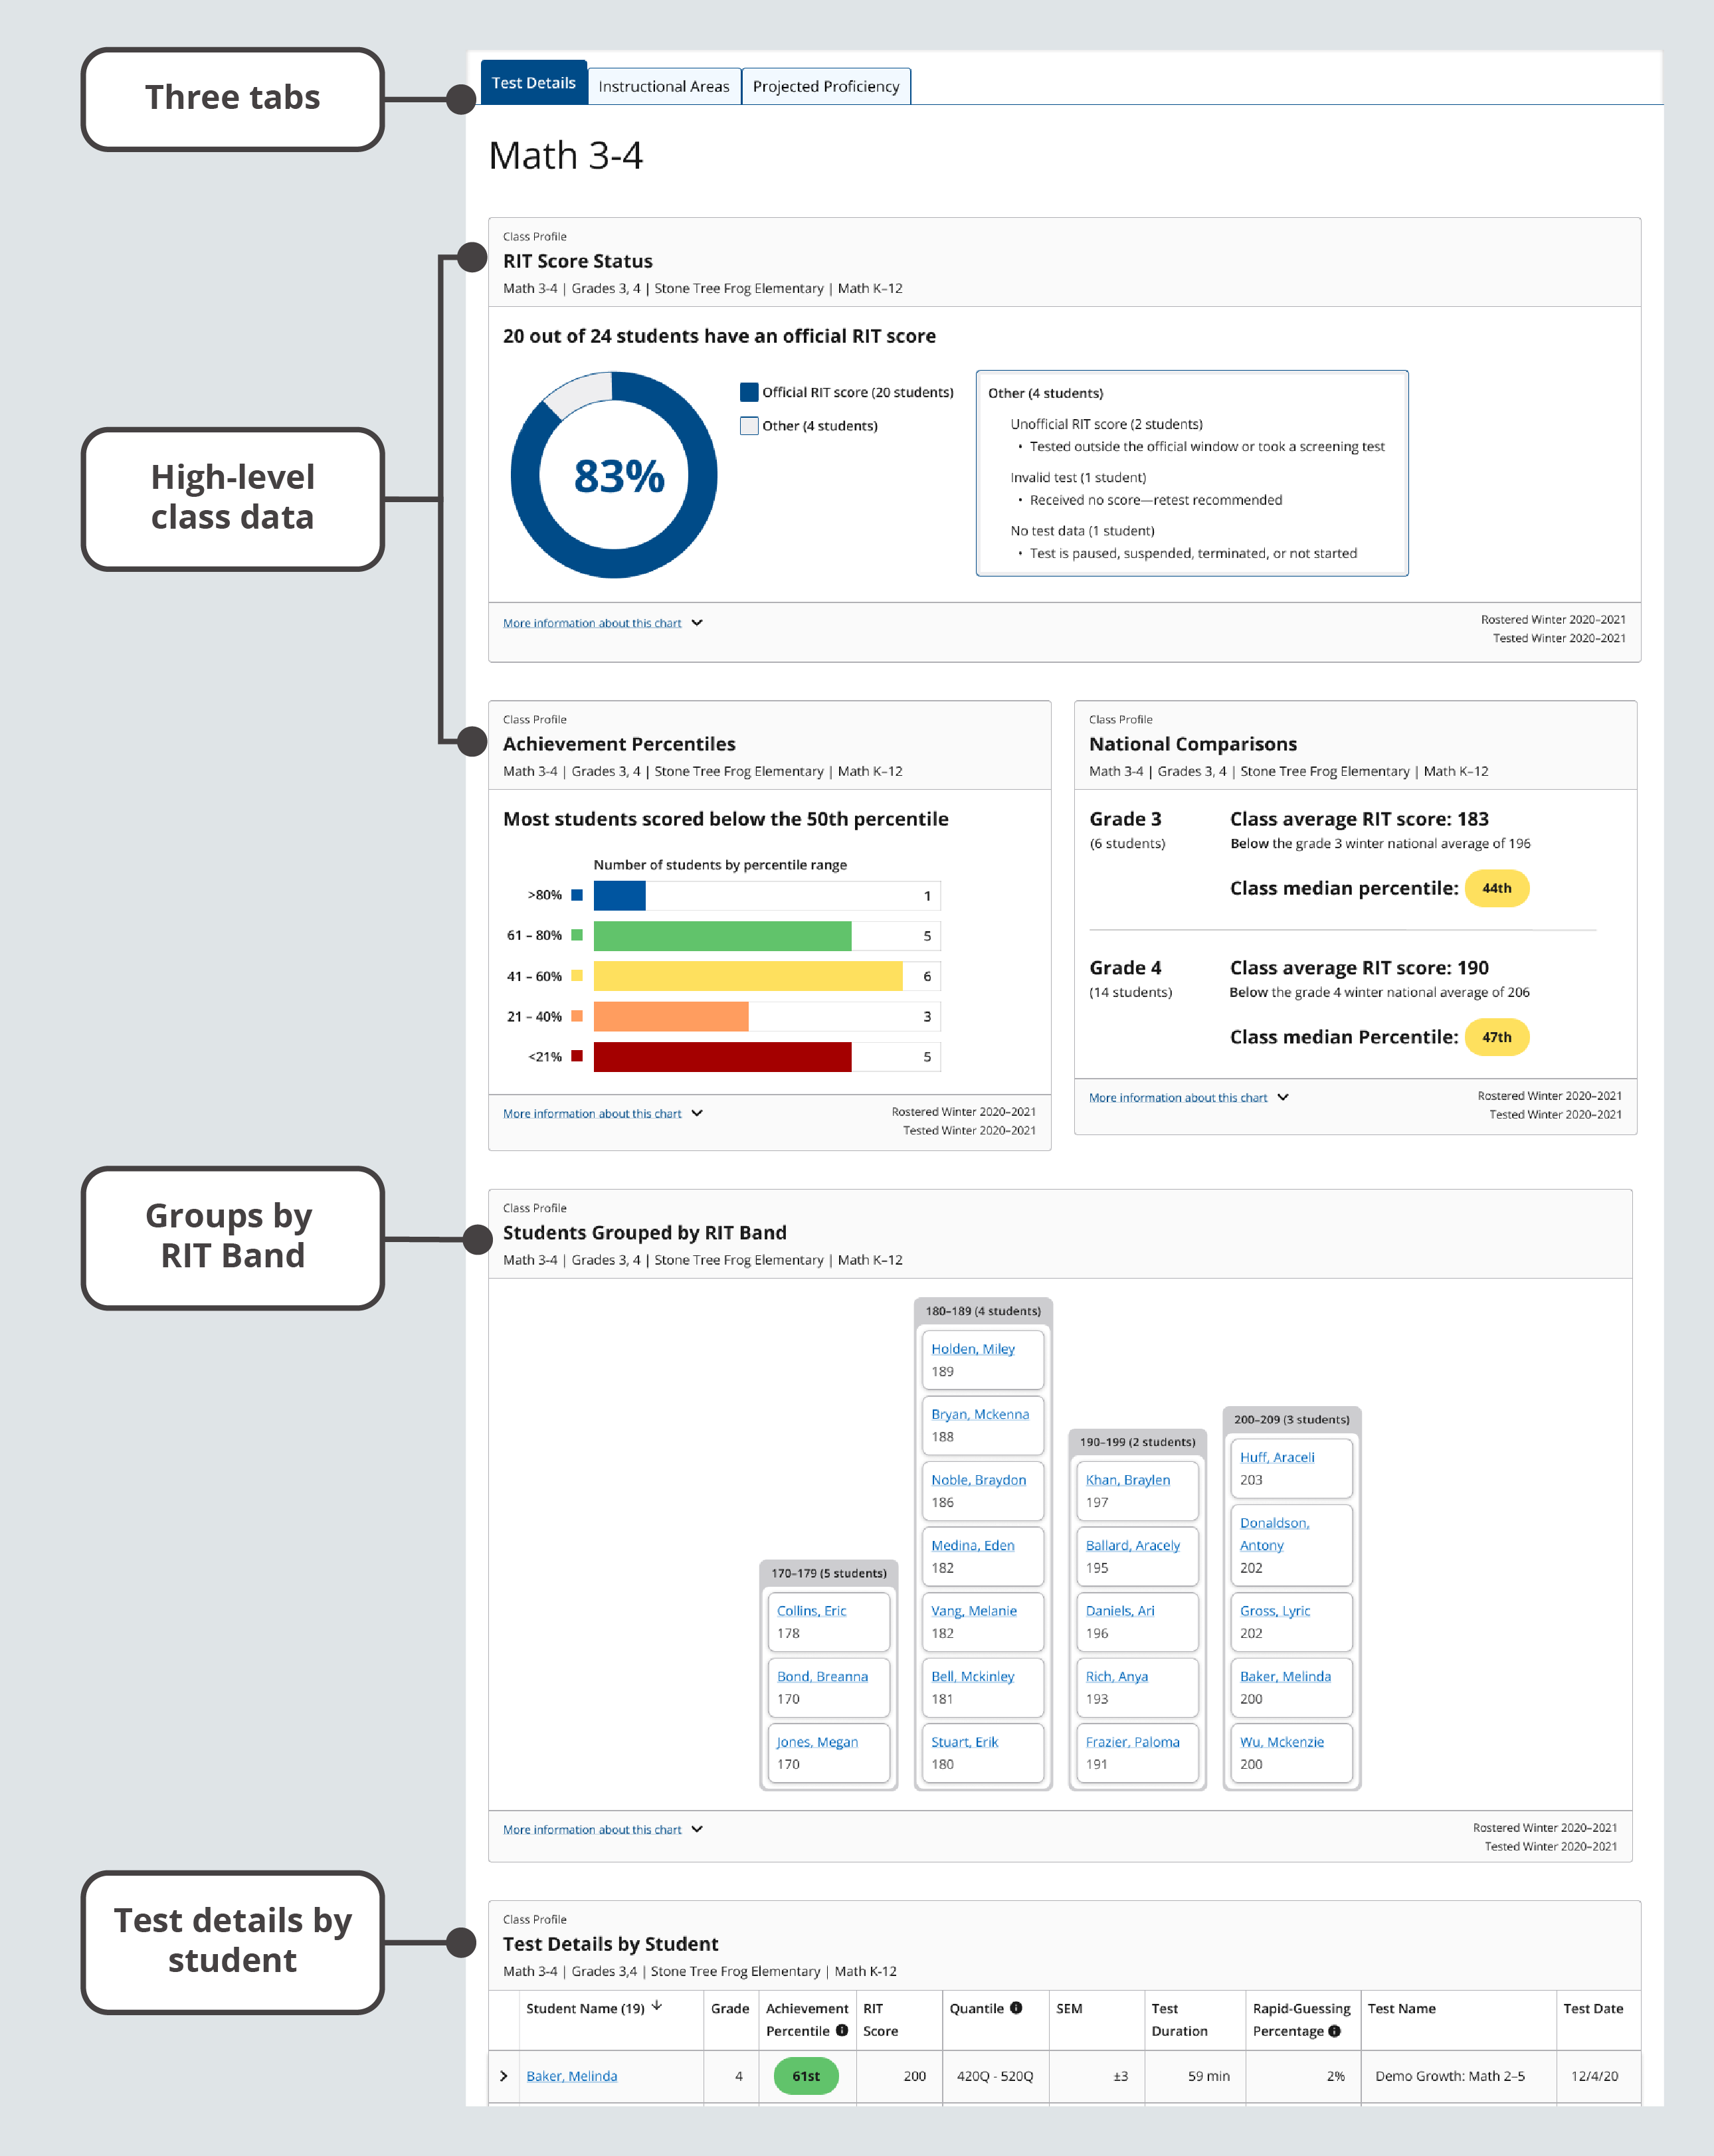
A few key features of the Class Profile report
Three tabs. Explore your class’s performance and your students’ testing status on the Test Details tab, understand the strength and opportunity areas for your class and students on the Instructional Areas tab, and review how your students’ MAP Growth scores project to performance on other tests on the Projected Proficiency tab.
High-level class data. Quickly access high-level class information through the RIT Score Status, Achievement Percentiles, and National Comparisons modules.
Groups by RIT Band. Review students grouped within 10-point RIT bands as quick reference for academic diversity and as a starting point for forming temporary, flexible learning groups.
Test details by student. Dive into testing and performance details for each student in your class.
Report requirements
The Class Profile report provides data visualizations with the requirements described in the table below.
| Condition | Explanation |
|---|---|
| Applicable MAP tests | Any reportable test event that’s completed. For more details, explore Invalid Tests and Unofficial RIT Scores. |
| Date range for reportable data |
All fall, winter, and spring terms, beginning with academic year 2020–2021. Note: Term Rostered is only available for the current and previous academic year. |
| MAP Roles for report access | Instructor, Administrator, School Assessment Coordinator, and District Assessment Coordinator. Learn more at Choose MAP Roles. |
Report access
To access the Class Profile report:
-
Log in at start.mapnwea.org and choose MAP Growth from the main menu.
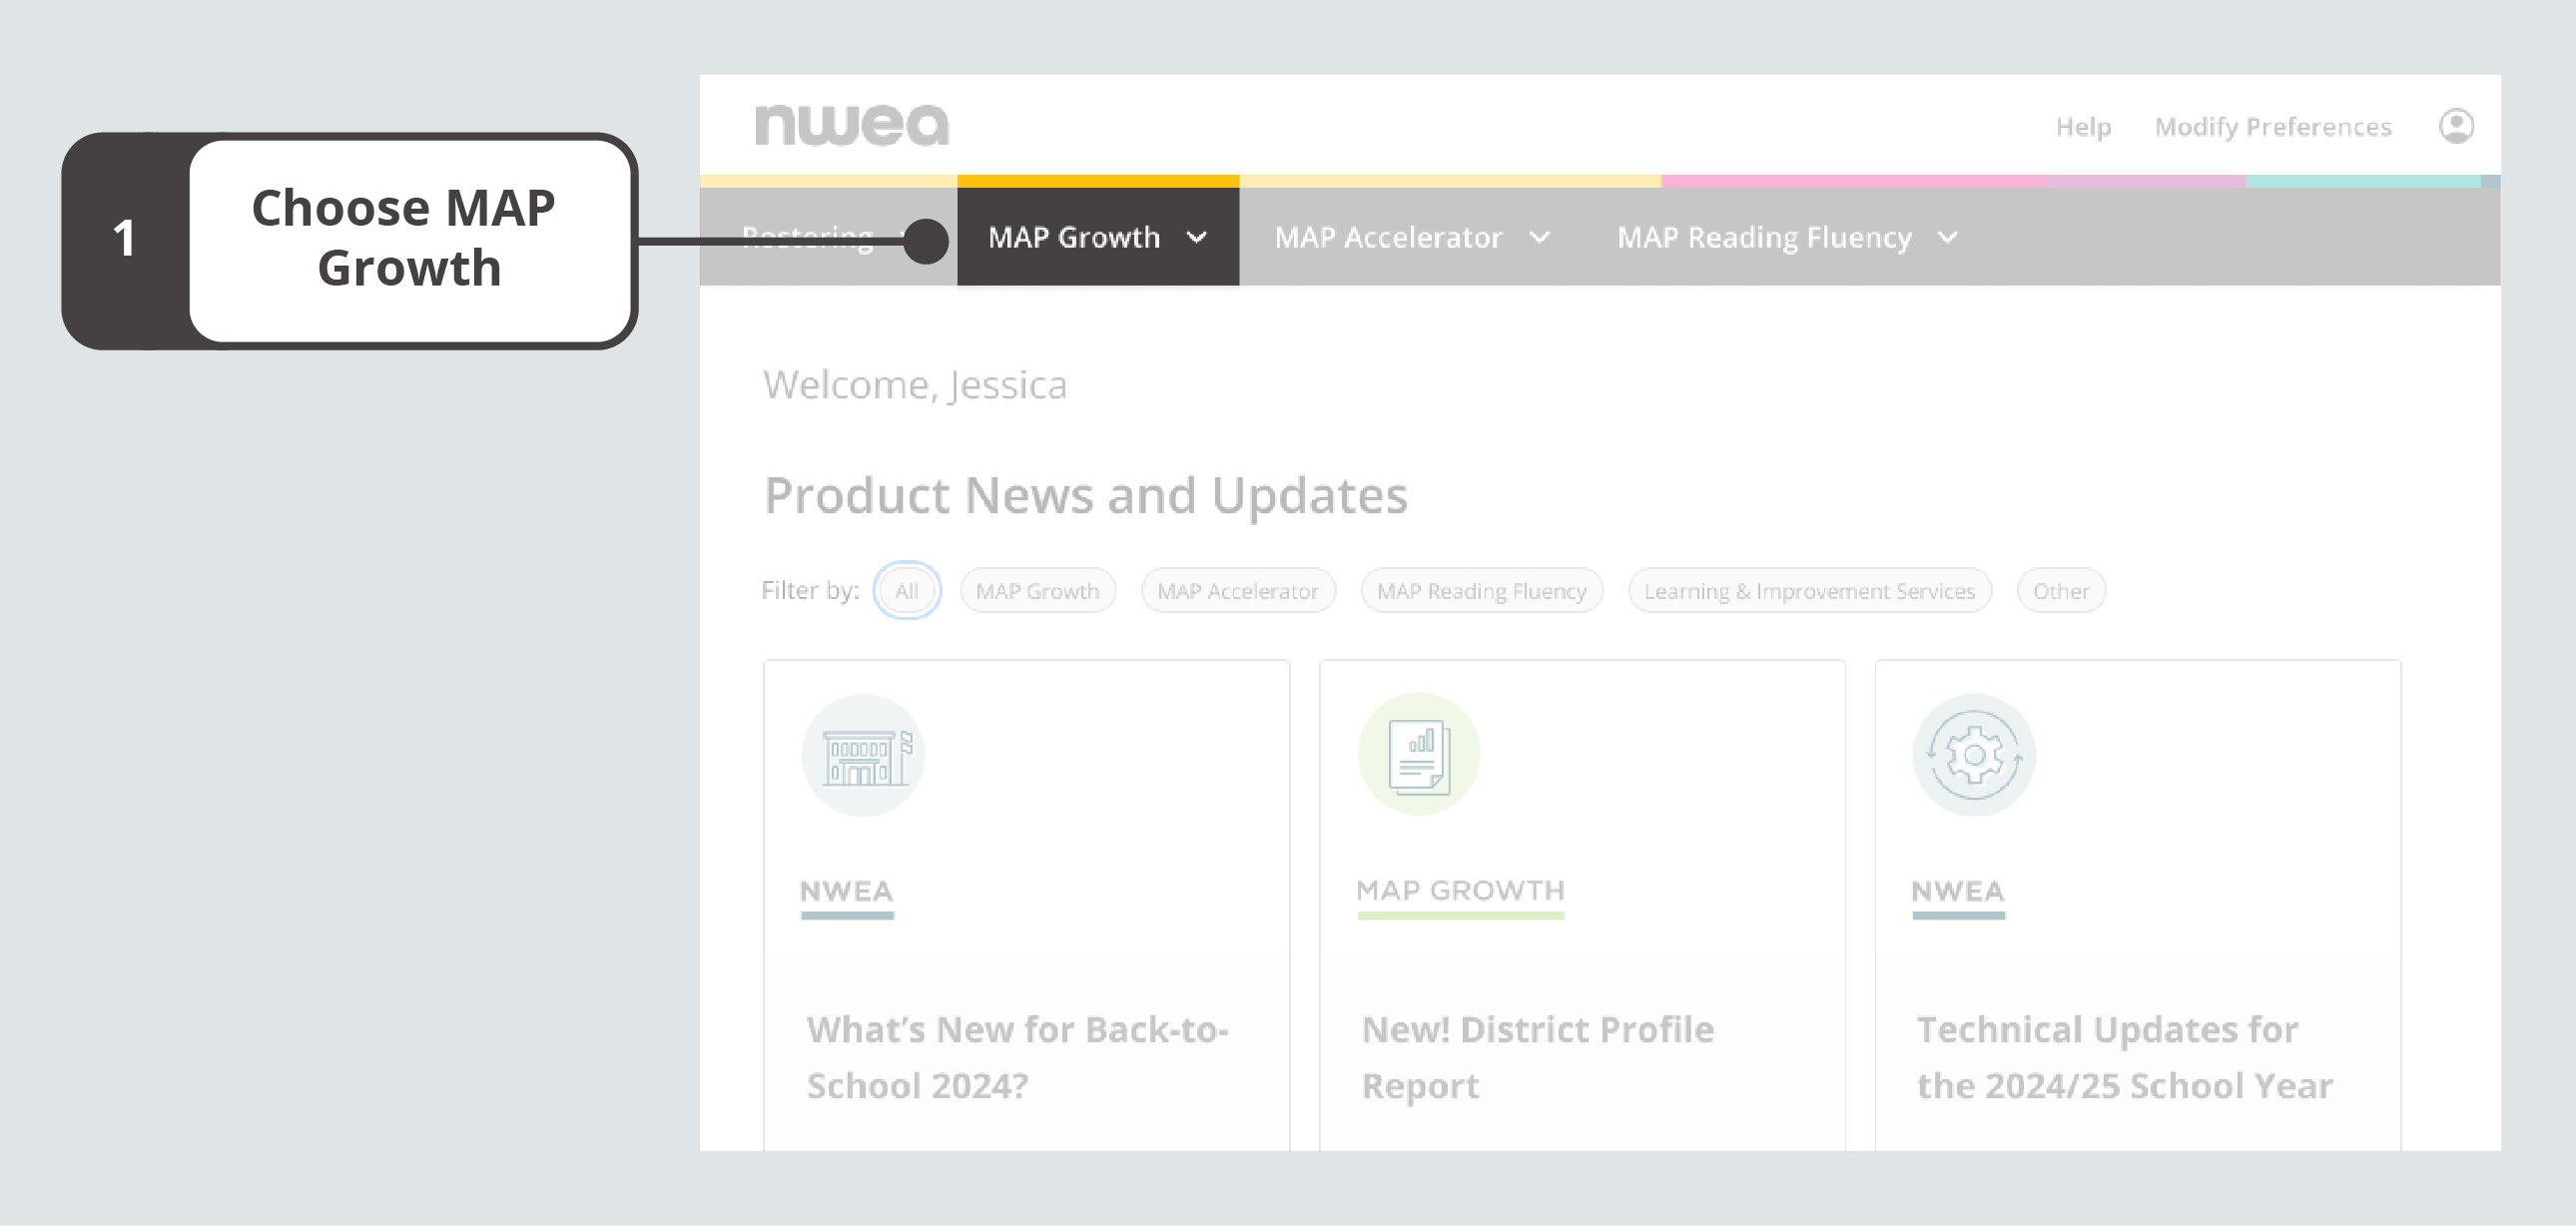
On the start page, choose MAP Growth
-
Select Class Profile.
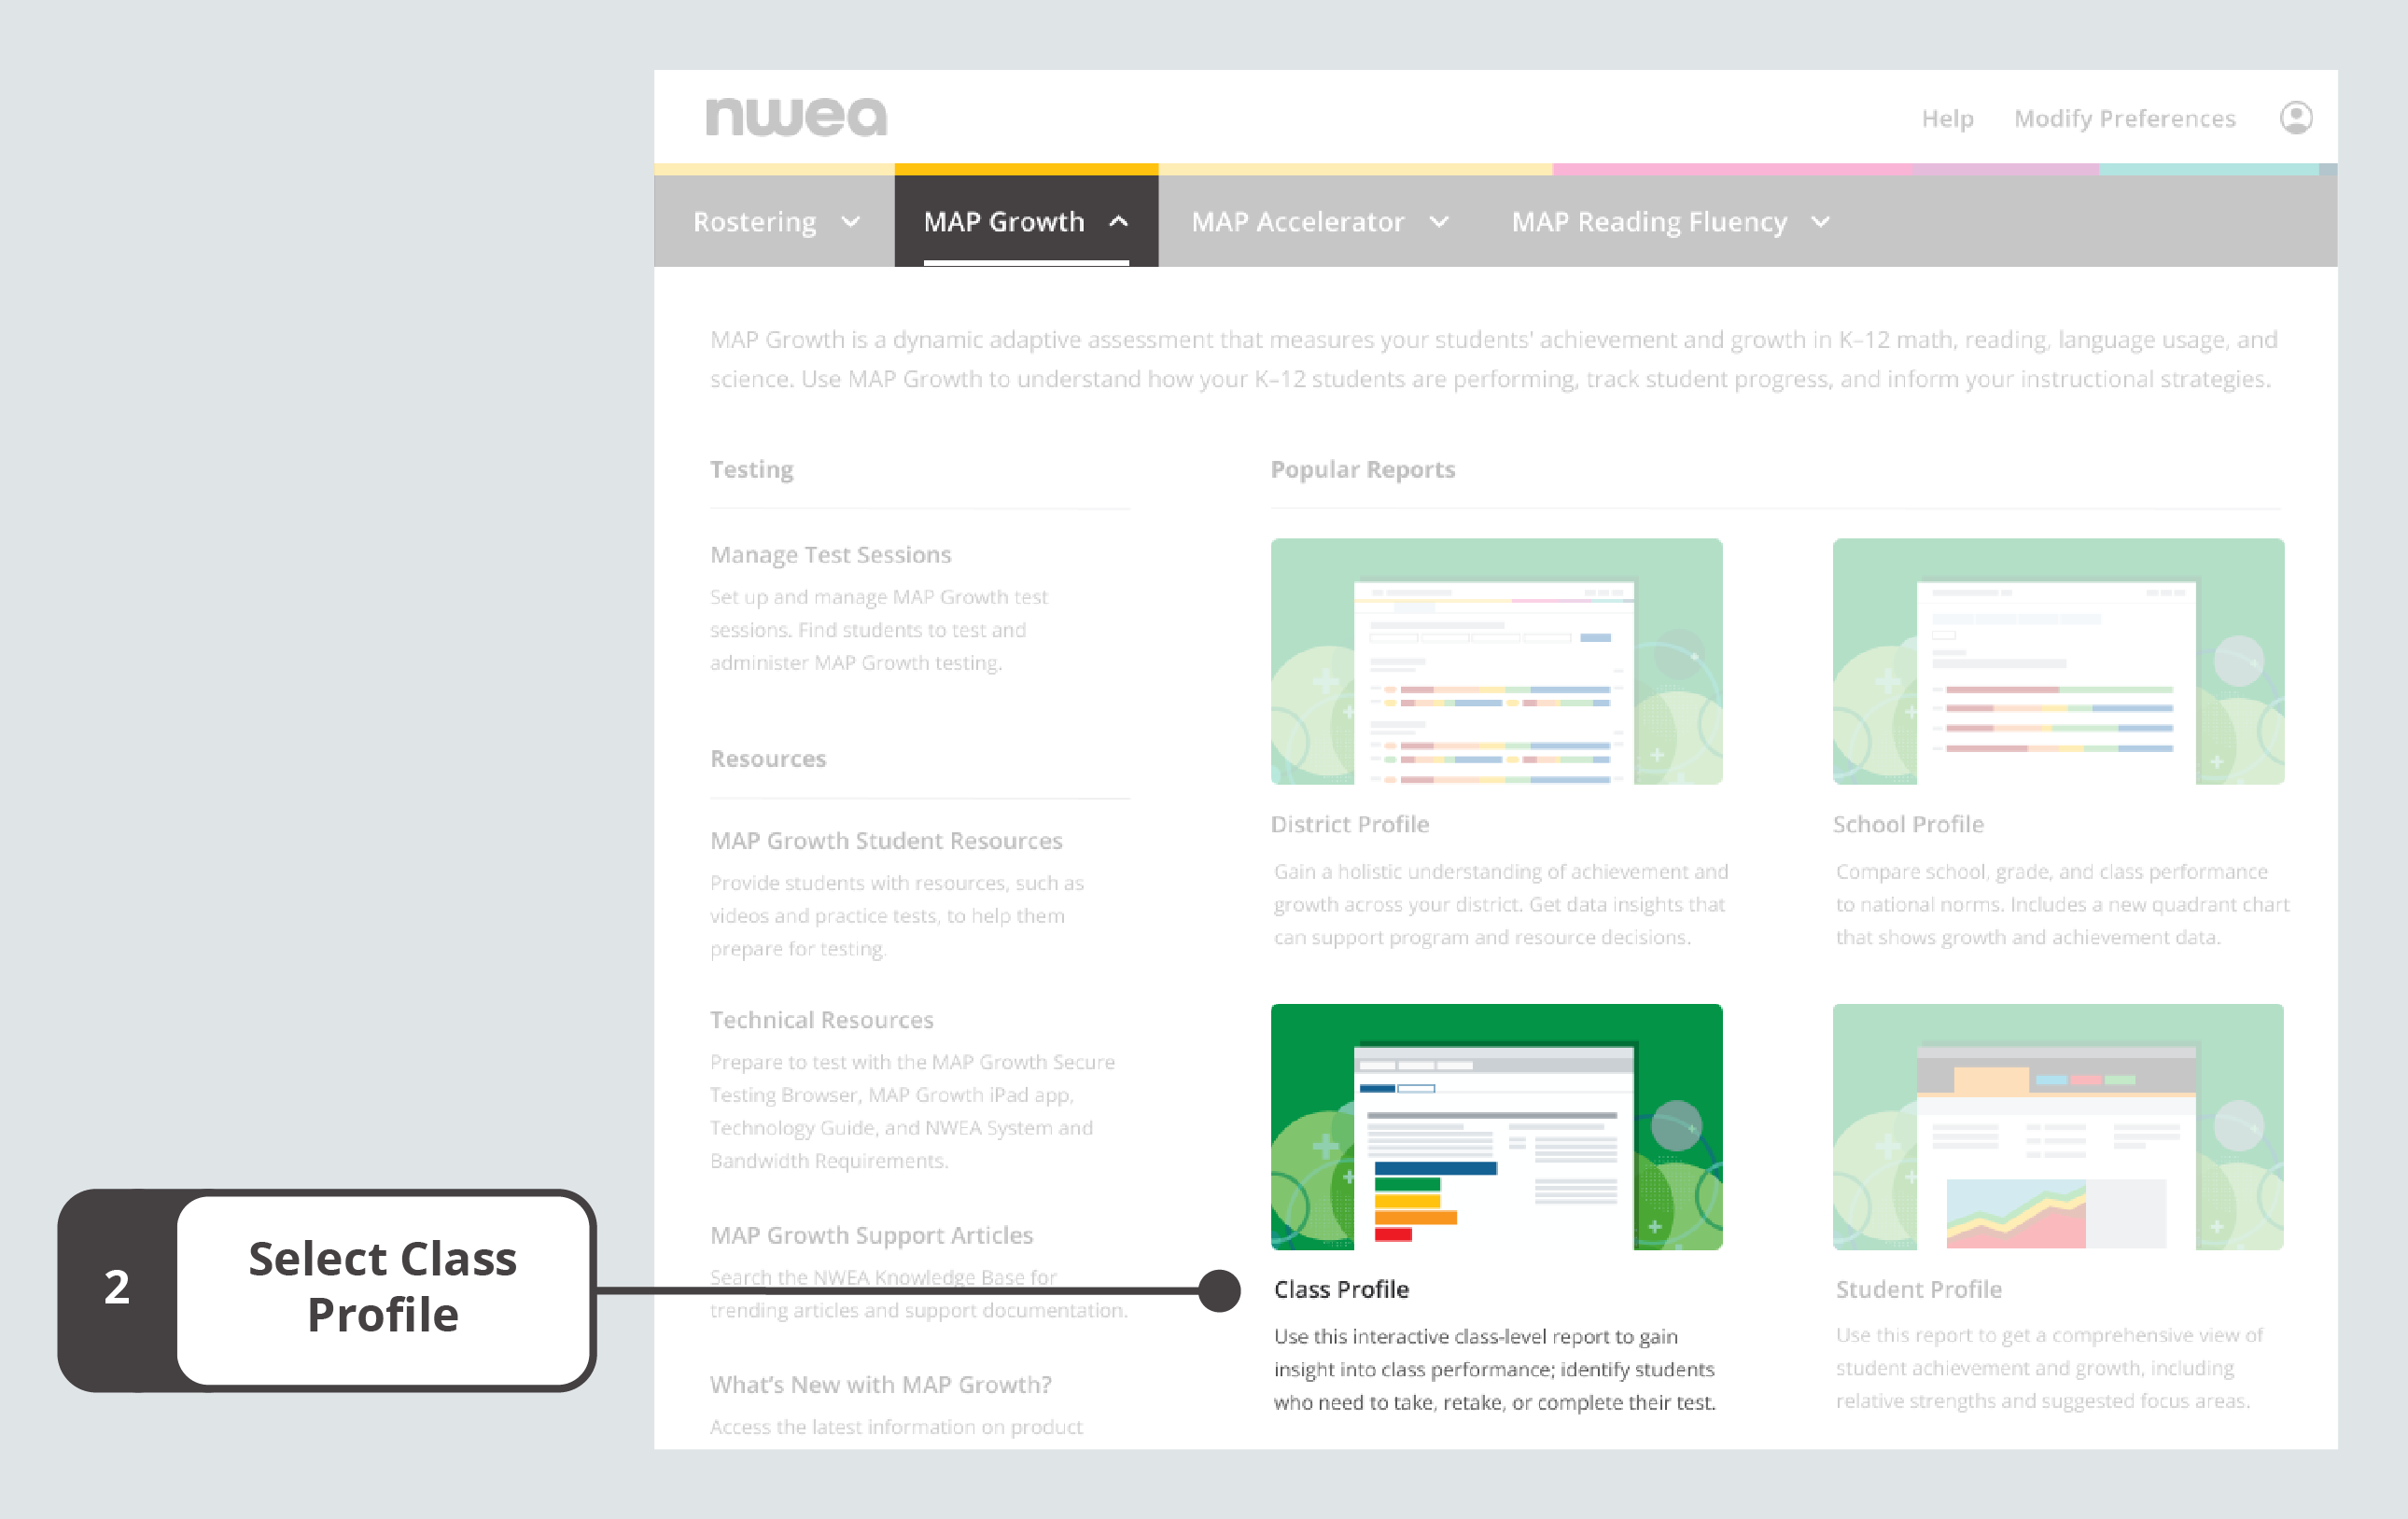
Select Class Profile from the MAP Growth menu on the start page
-
Review the default values at the top of the report for School, Tested, and Rostered, and choose Change selections if needed.

Review default values and change selections as needed
-
This will expand a section with all the fields you can adjust. After choosing field values, you can select “Make this my default Selection” to reduce repetitive selections.

Choose new values and set new default selections
-
Select Update and review the results.
-
-
Review the field values for Instructor, Class, Subject, and Course, and adjust as needed.
-
Select Update and review the results.
Creating a CSV or PDF
In addition to accessing the Class Profile report online, you can review your data in the following formats:
-
CSV—select Download.CSV directly beneath the selection section at the top of the report.
-
Print or PDF—select Print.PDF above the first module. For best results, be sure your layout is set to Landscape.
Exploring the Test Details tab
Use the Test Details tab to explore high-level data for your class performance and testing status, get a sense of the academic diversity in your classroom, and dive into testing and performance details for each student in your class.
Confirm that the Test Details tab at the top of the Class Profile report is selected
RIT Score Status
The RIT Score Status module shows the status of RIT scores across your class.
The donut chart represents students' official RIT scores and other results, such as unofficial RIT scores, invalid tests, and no test data. You can use this information to quickly understand what portion of your class has an official RIT score.
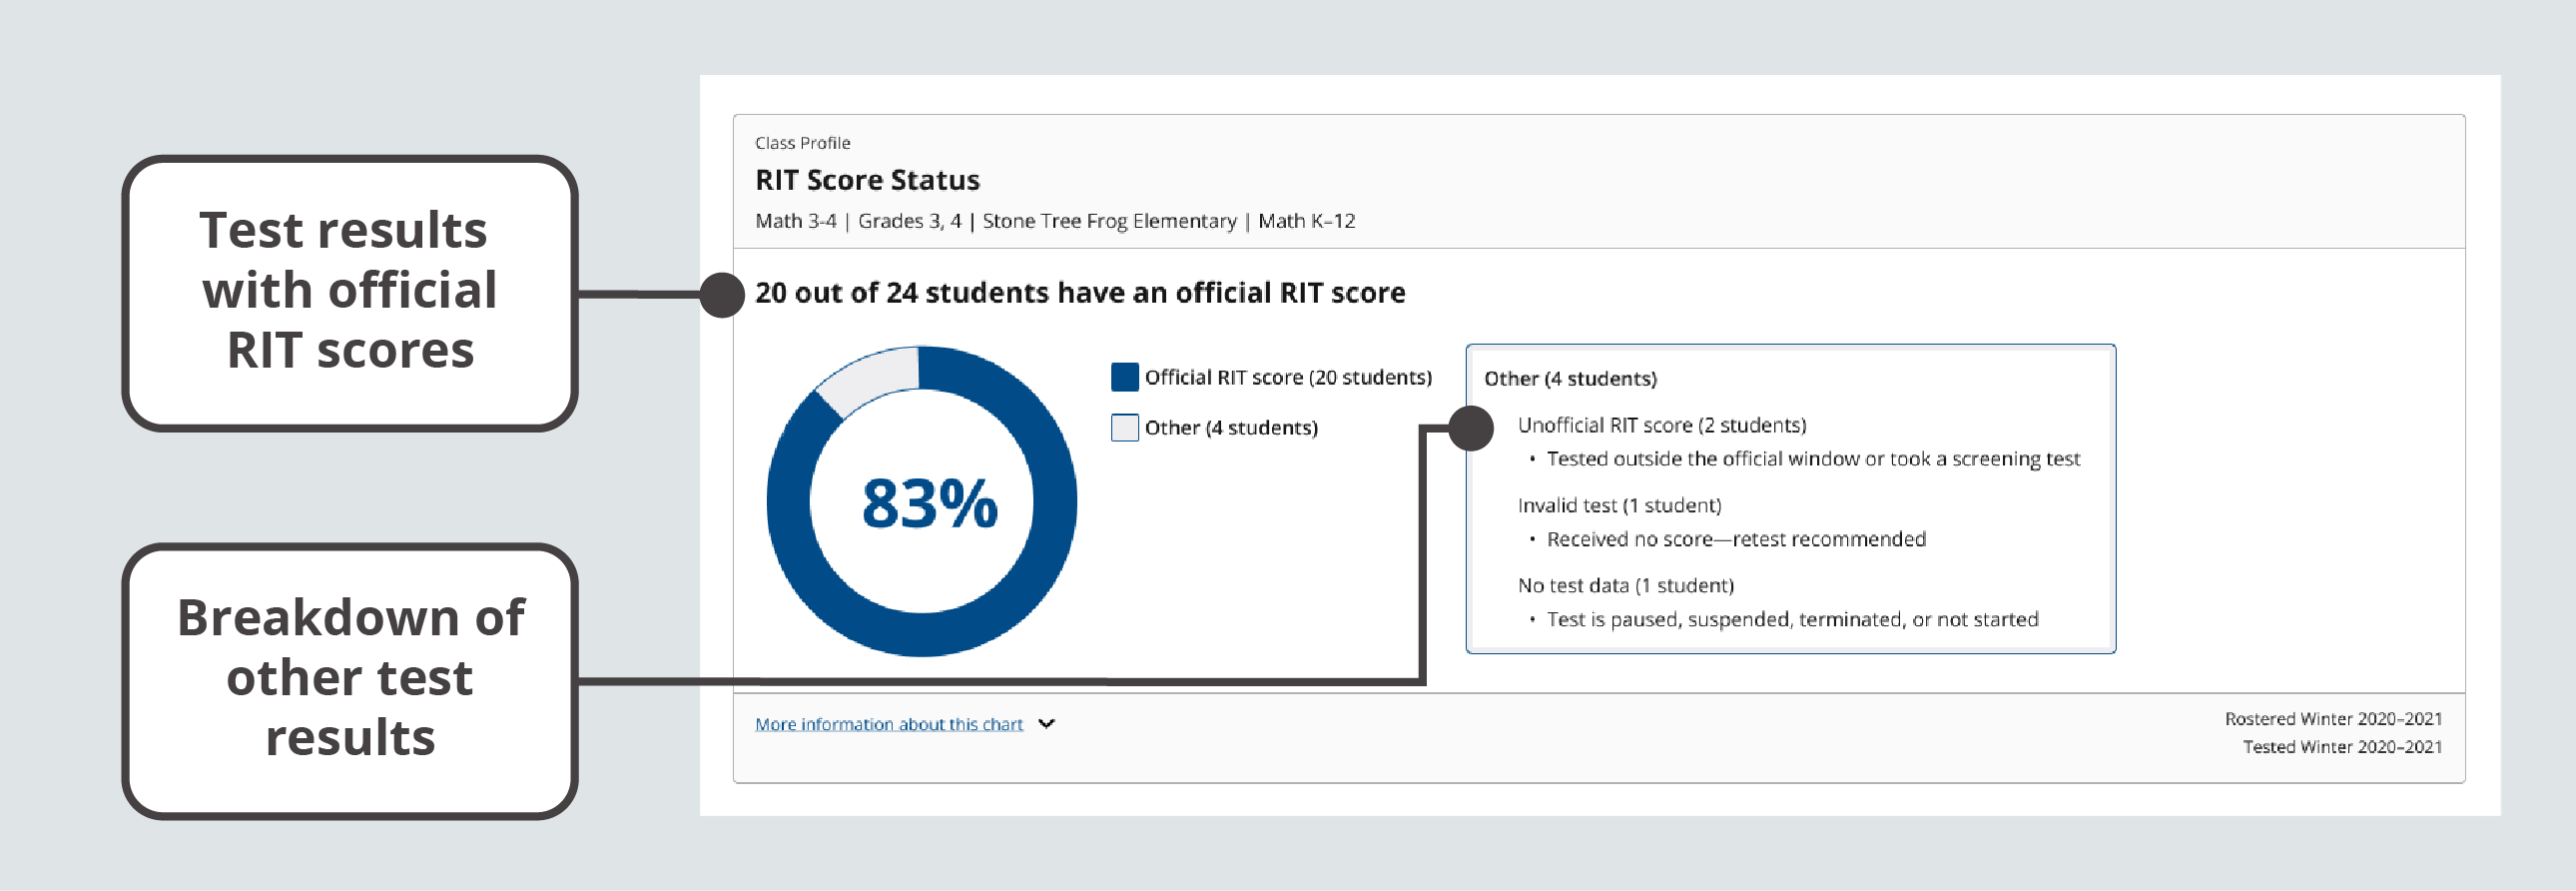
RIT Score Status module
| Data point | Explanation |
|---|---|
| Official RIT score | A valid test result that is used to measure growth between two terms. |
| Unofficial RIT score |
A RIT score from a test event that isn’t used to measure growth between two terms. Produced in these situations: 1) screening test, 2) outside test window, 3) same test more than once (test with lowest SEM = official, others = unofficial). |
| Invalid test | A test event with no score because it didn’t meet reliability standards. We recommend retesting. |
| No test data | Test is paused, suspended, terminated, or not started. |
Achievement Percentiles
This Achievement Percentiles module shows the distribution of achievement percentiles for your entire class.
The achievement percentiles are organized into five percentile ranges, also known as quintiles. You can use this visualization to understand how student scores in your class compare to other same-grade US student scores.
If your class includes students in several grades, the chart will still display your class data in a single visualization, giving you a holistic sense of how all your students are performing relative to their academic peers.
The Achievement Percentiles chart also states how most of your class performed relative to the 50th percentile. This offers you a quick data point for the overall performance of your class.
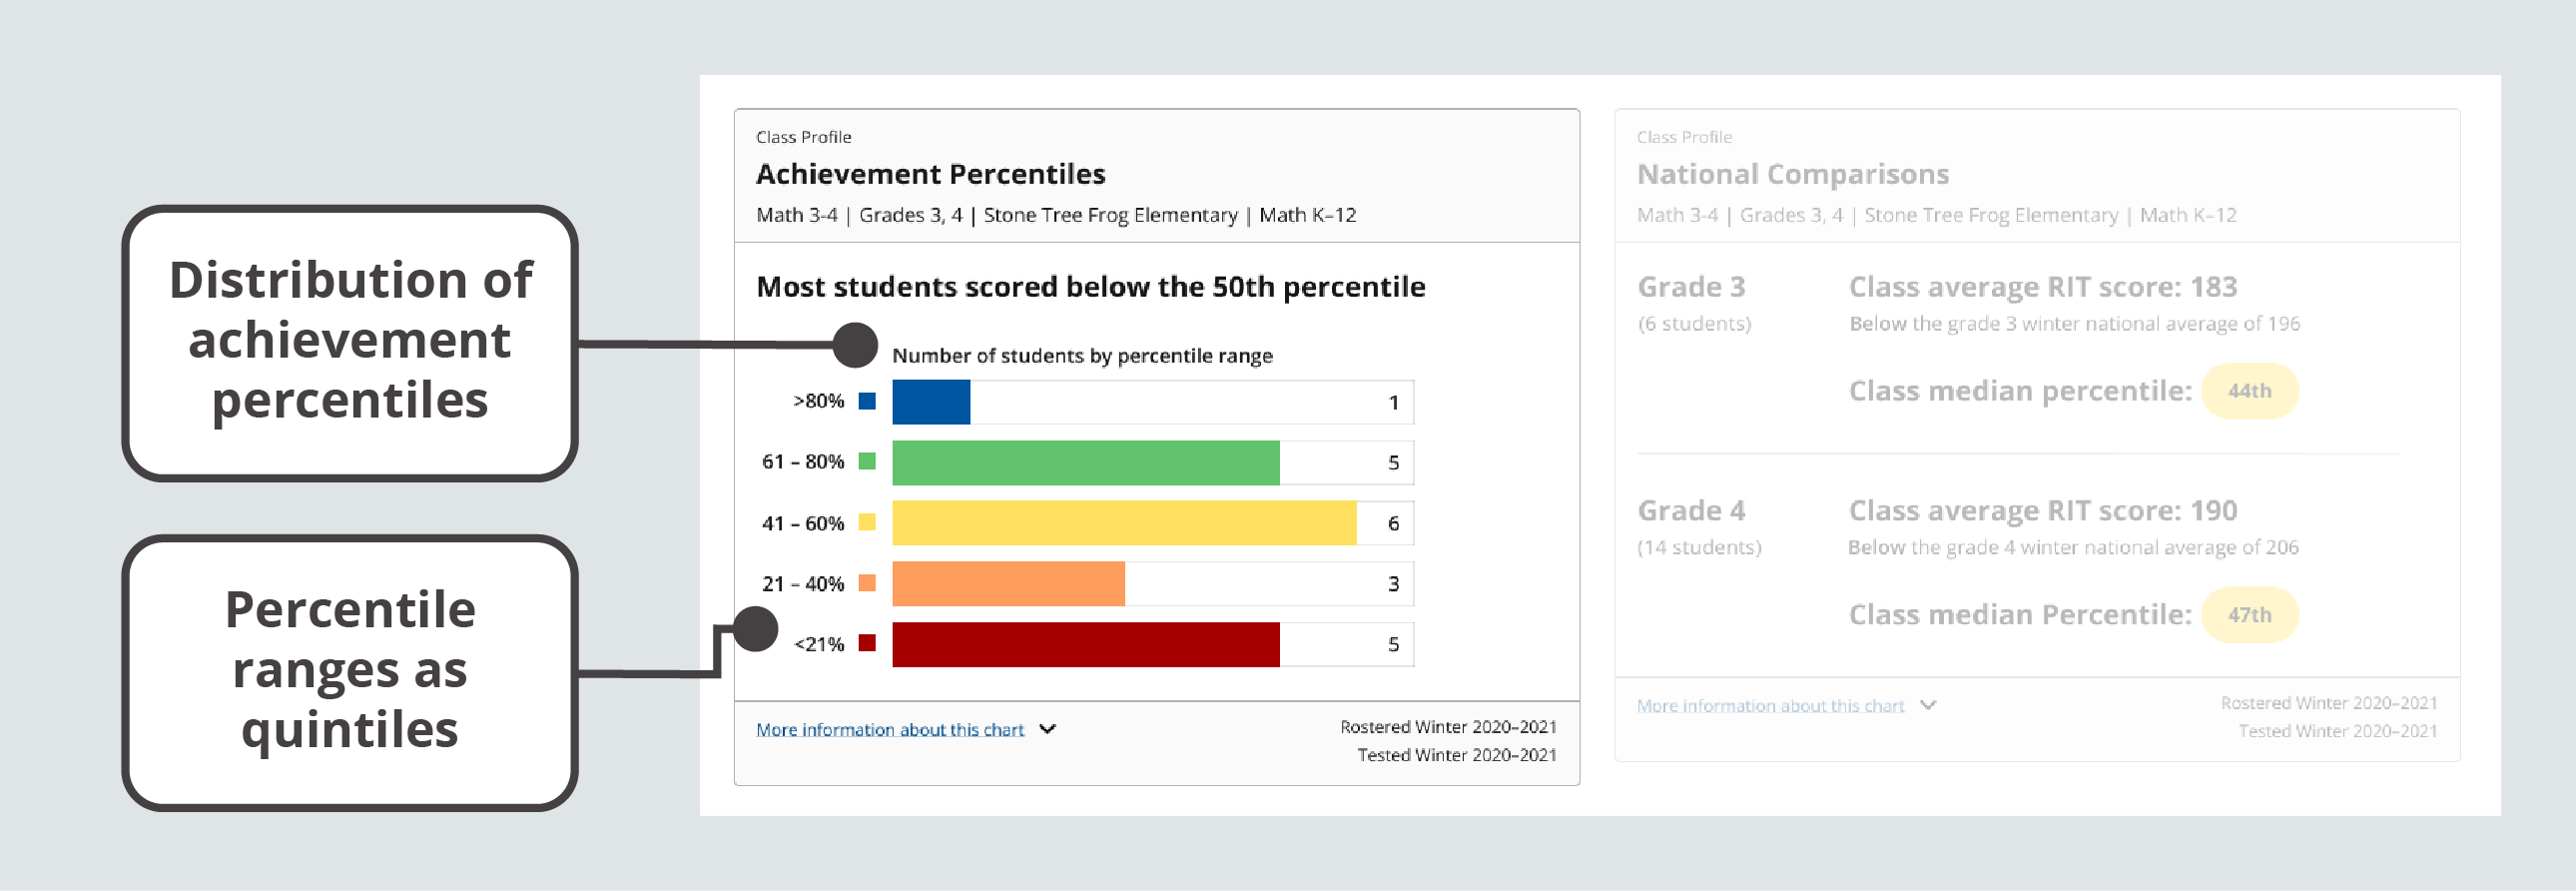
Achievement Percentiles module
| Data point | Explanation |
|---|---|
| Achievement percentile | A percentile ranking based on MAP Growth Norms for achievement in one testing term. Percentiles are color coded by range as shown in the key. Percentiles for unofficial RIT scores appear in gray. |
| Distribution |
A representation of the range of scores for a group of students, indicating the number and/or percentages of scores within five percentile levels, or quintiles. |
| Percentile | Norm-based information about where a student’s observed score falls within the range of scores produced by other same-grade US students. |
| Quintiles | Five percentile levels based on NWEA normative data: 1st–20th (red), 21st–40th (orange), 41st–60th (yellow), 61st–80th (green), and greater than 80th (blue). |
National Comparisons
The National Comparisons module shows the average RIT and median percentiles for each grade in your class.
Class average RIT scores are compared to the national average RIT score for that grade and median percentiles are based on national norms for that grade. You can use these data points as a snapshot of student performance for each grade in your class.
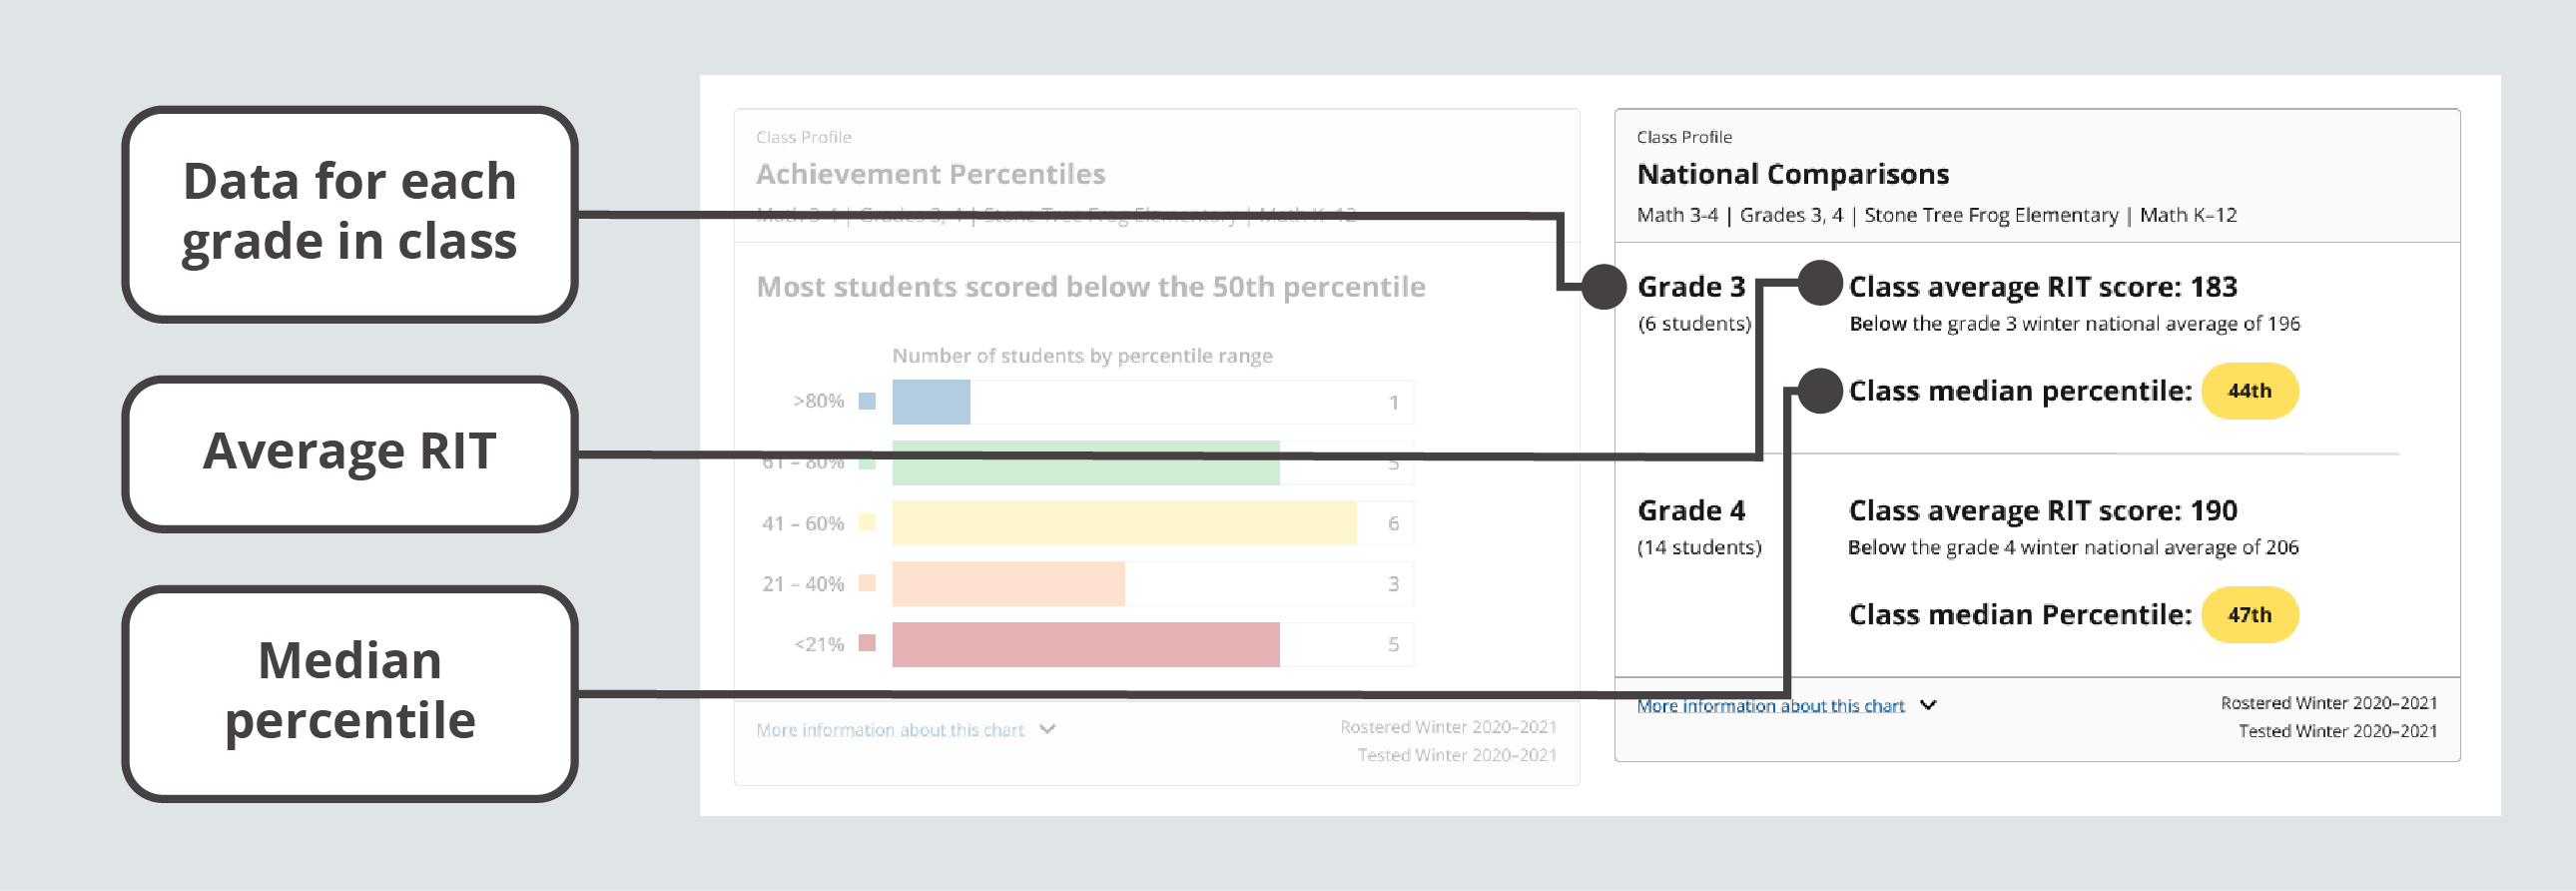
National Comparisons module
| Data point | Explanation |
|---|---|
| Average RIT | The average RIT score for a group of RIT scores, calculated by adding all the scores within a group and then dividing that sum by the number of scores within the group. |
| Percentile |
Norm-based information about where a student’s observed score falls within the range of scores produced by other same-grade US students. |
| Median Percentile | The middle percentile value when a group of percentiles are ordered from lowest to highest. |
Students Grouped by RIT Bands
The Students Grouped by RIT Bands module shows you a distribution of student performance organized into 10-point ranges of RIT scores.
Each stack represents students who scored within a 10-point RIT range, giving you a sense of how alike or different each student in your class is across each subject. You can use this data as a starting point for forming temporary, flexible learning groups in your classroom.
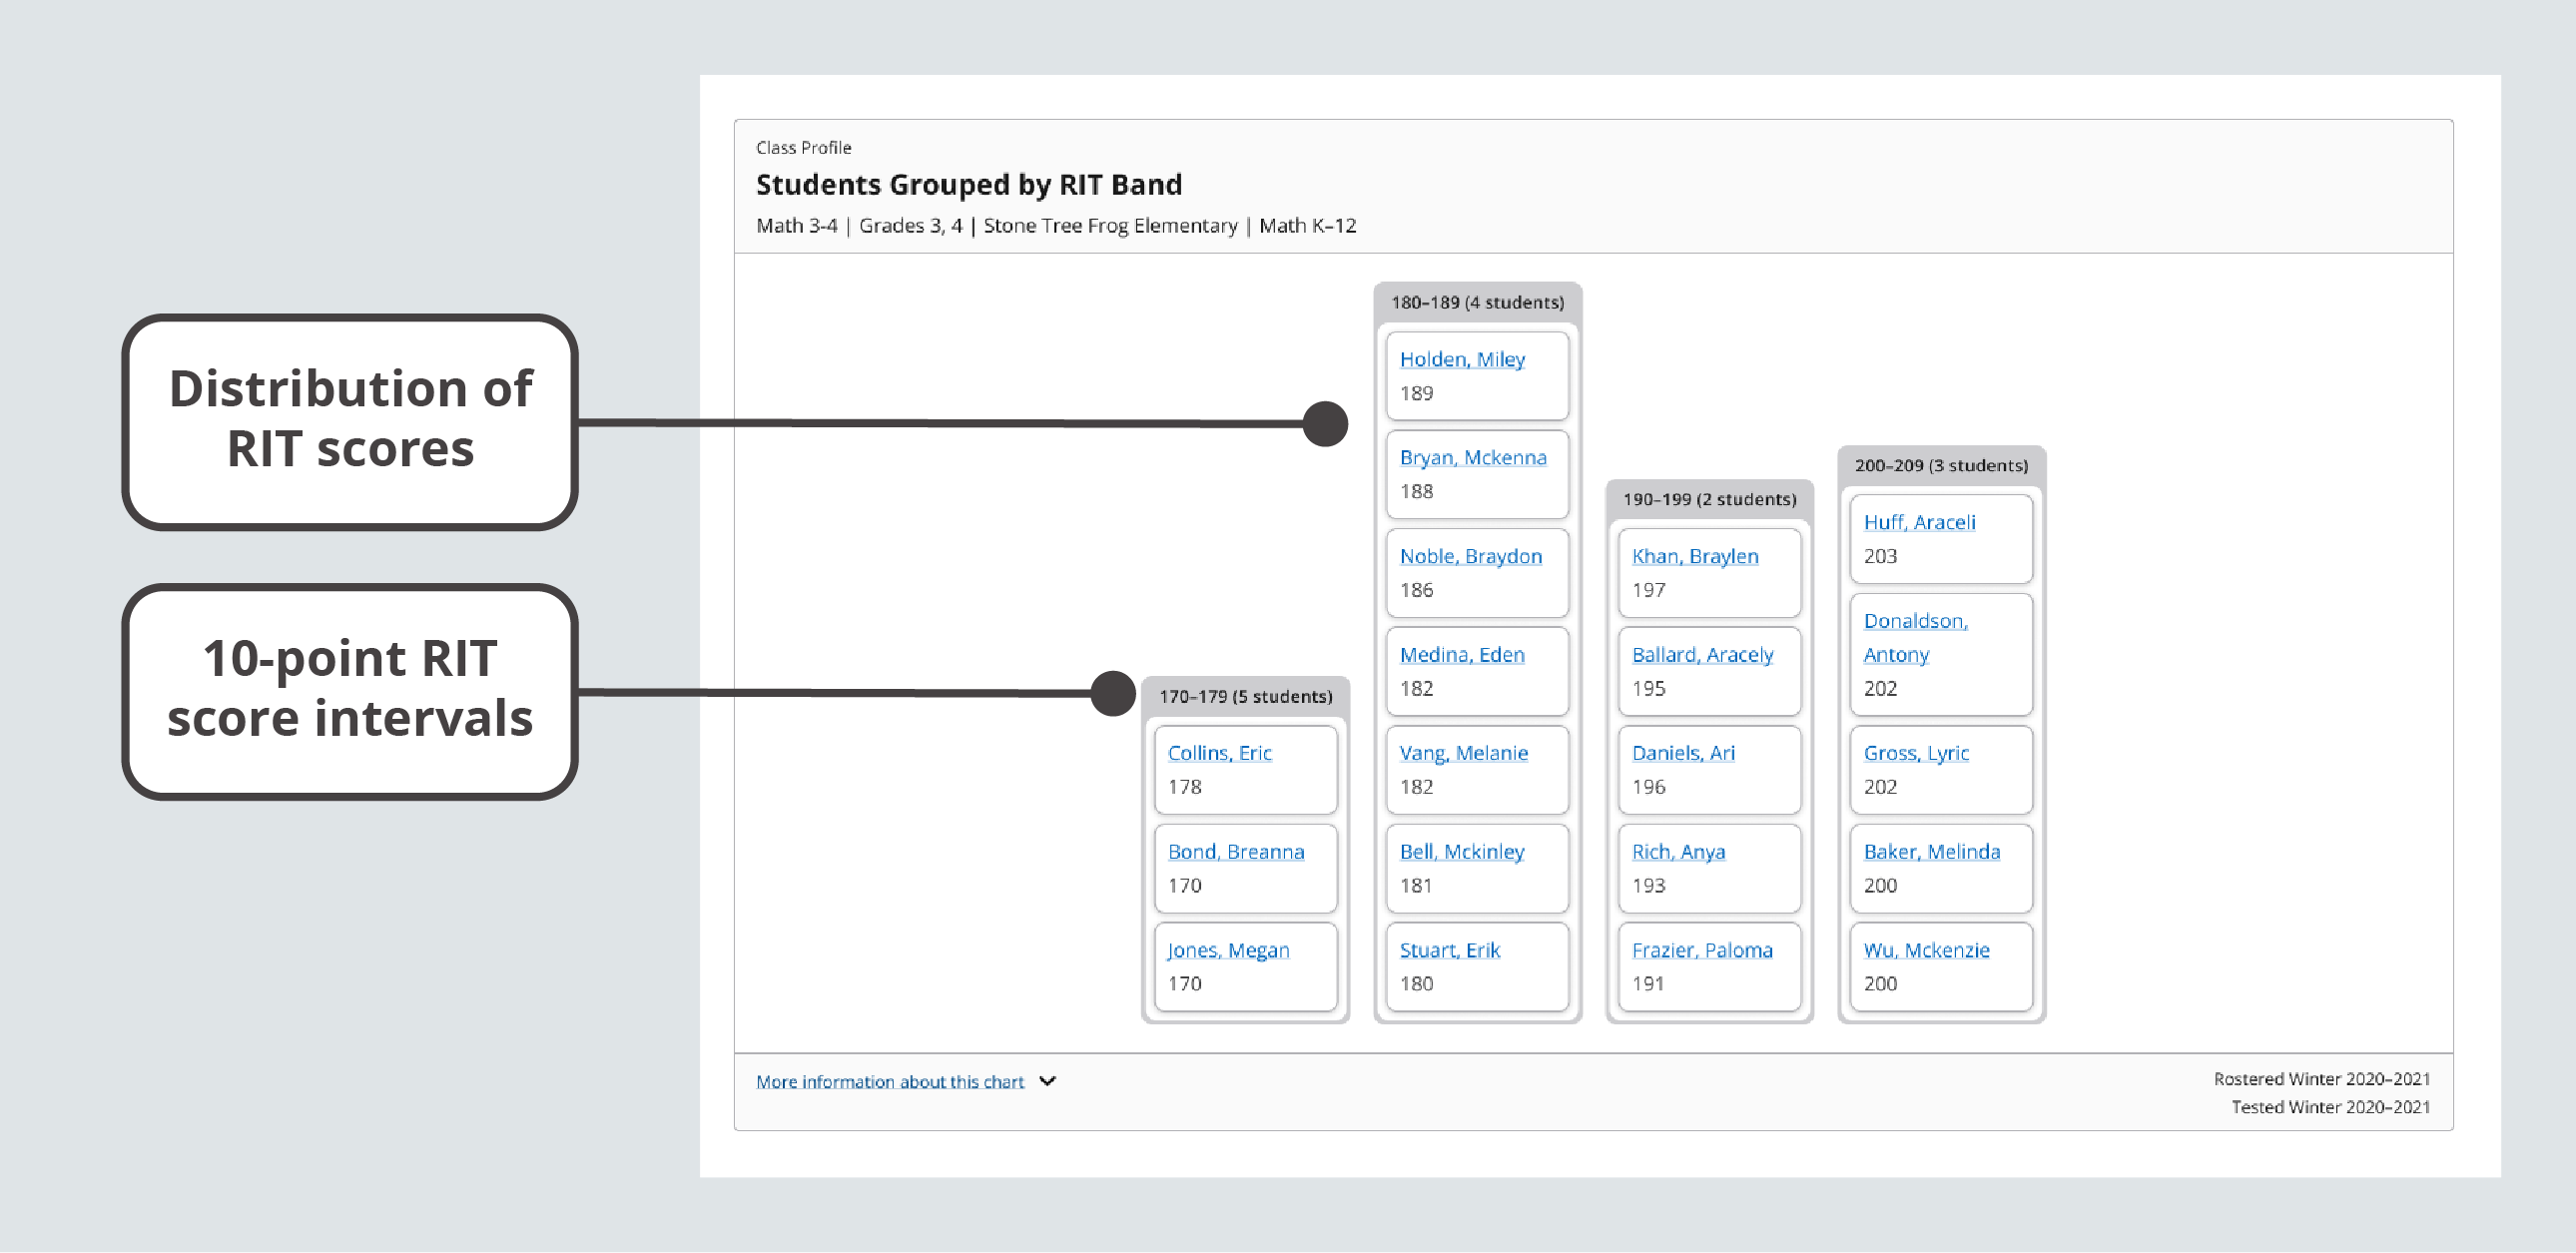
Students Grouped by RIT Bands module
| Data point | Explanation |
|---|---|
| RIT Band | A 10-point range of RIT scores that may be a helpful starting point for forming temporary, flexible learning groups in your classroom. You can use the Learning Continuum to explore test content associated with any RIT band. |
Test Details by Student
The Test Details by Student table shows you a list of your students with details about the test(s) they’ve taken and the results(s) they’ve received.
Each row represents a student and their performance on a particular test along with details about the test session. In some instances, you can expand a row to find more information about a test result or find additional tests. You can use this chart to understand individual student performance.
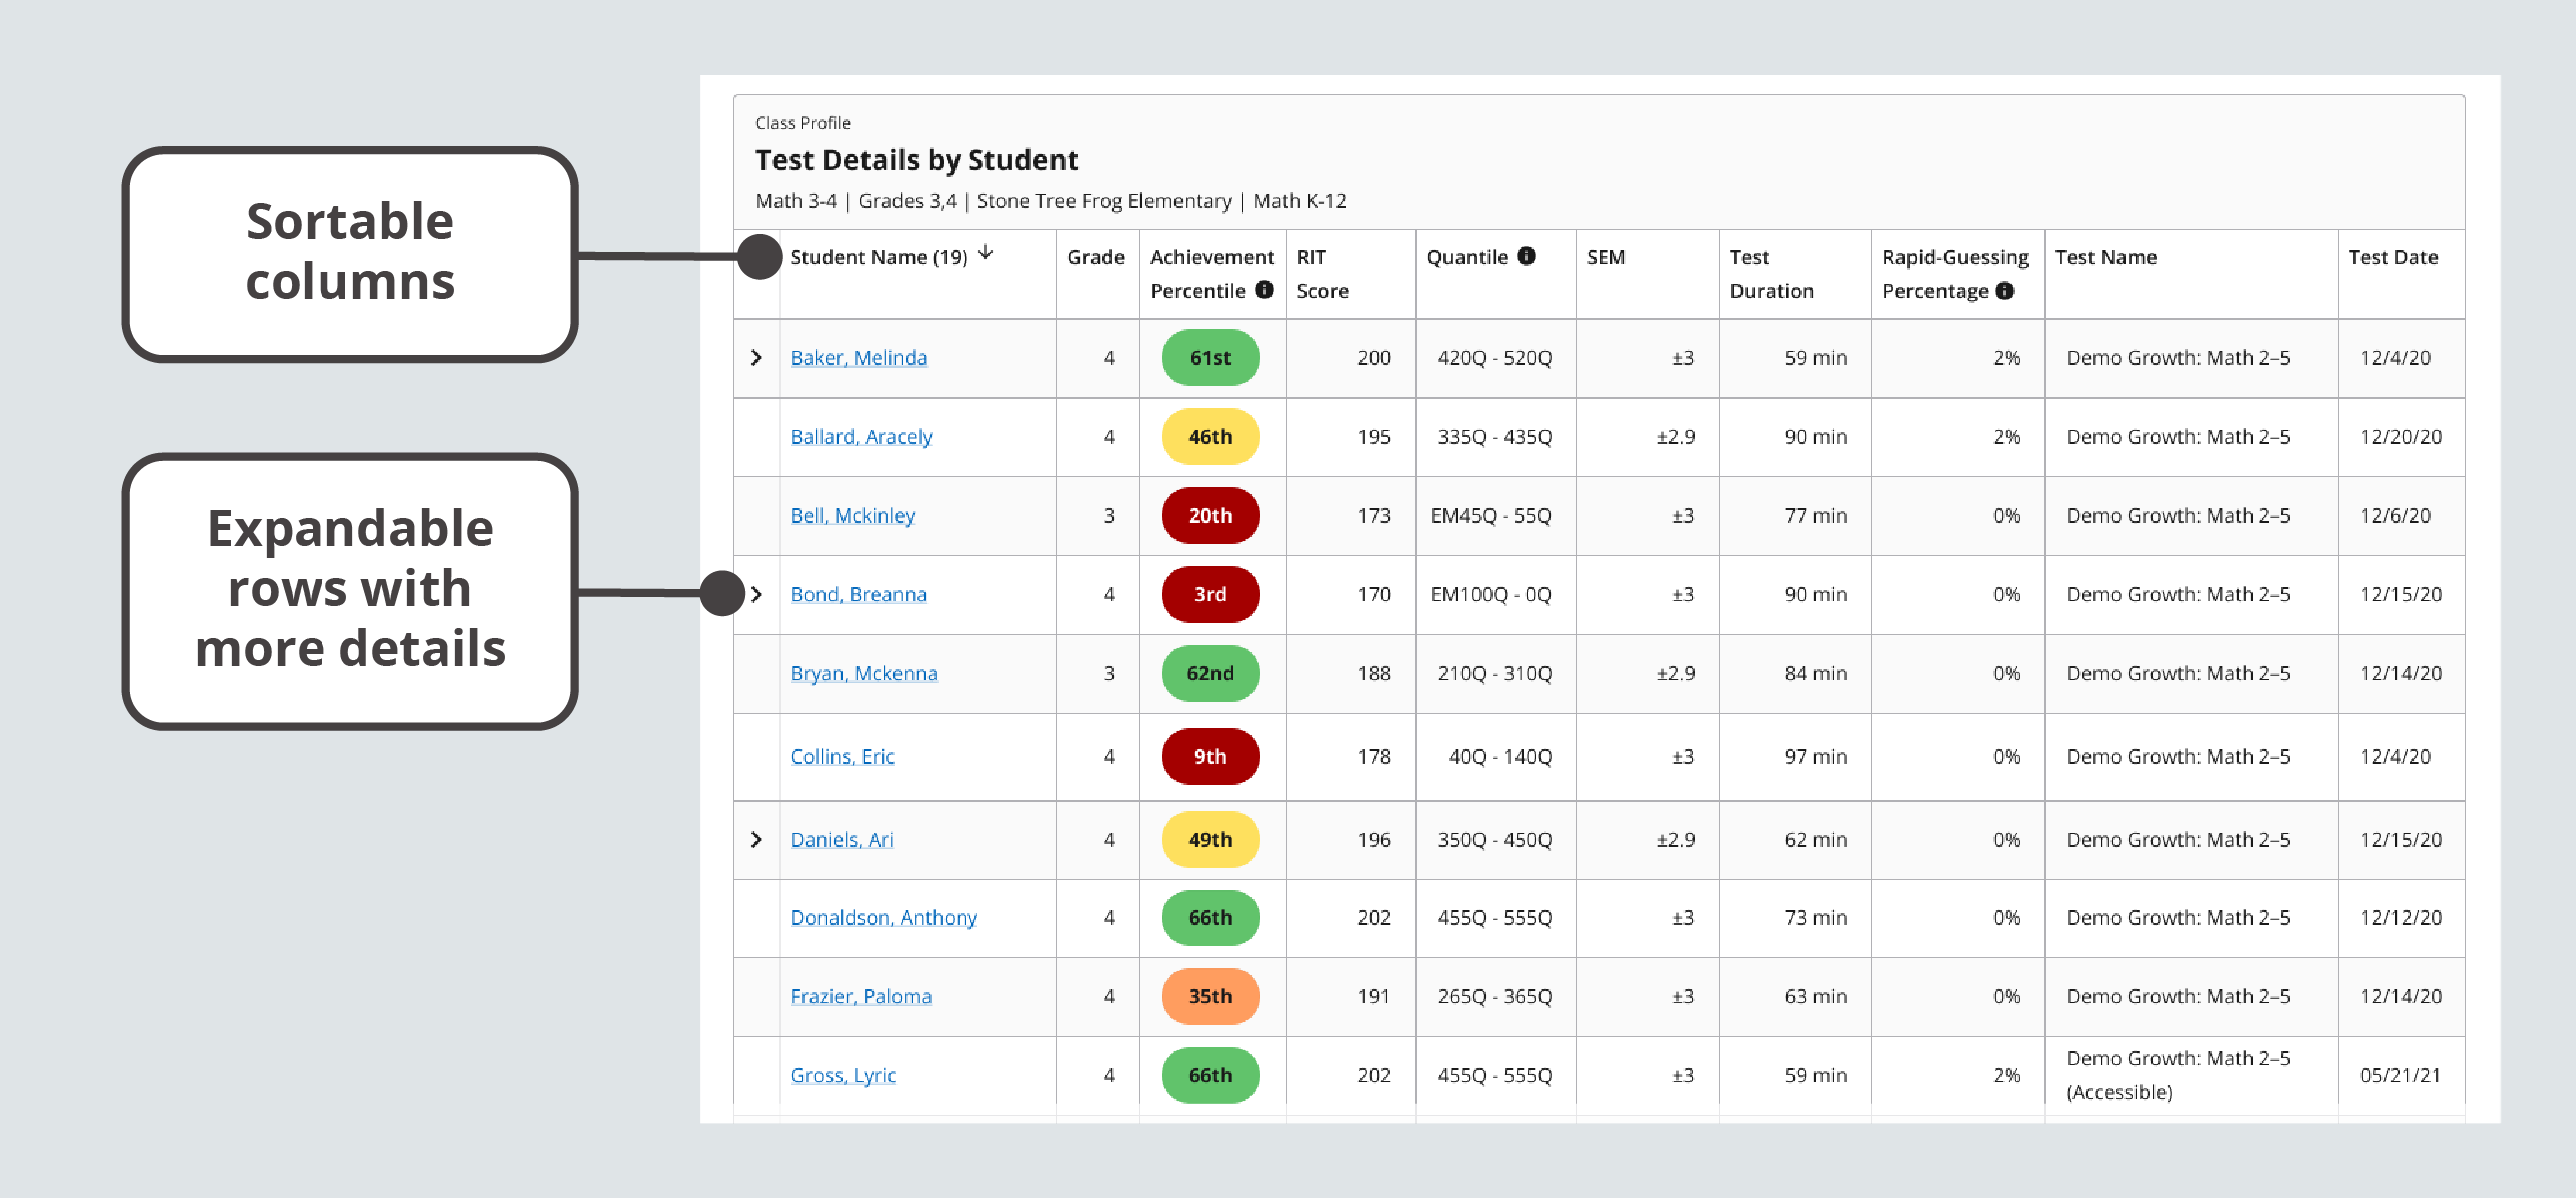
Test Details by Student module

Expanded row from the Test Details by Students table with multiple tests results

Expanded row from the Test Details by Students table with additional details for an invalid test
| Data point | Explanation |
|---|---|
| Achievement Percentile | A percentile ranking based on MAP Growth Norms for achievement in one testing term. Percentiles are color coded by range as shown in the key. Percentiles for unofficial RIT scores appear in gray. |
| Quantile | The Quantile Framework® for Mathematics, developed by MetaMetrics®, provides a nationally recognized measure aligned to MAP Growth math RIT scores. Quantile measures can help you find appropriate mathematical content for students. Note about EM (Emerging Mathematician): the lower the number, the more advanced the student’s abilities. |
| Lexile | The Lexile Framework® for Reading was developed by MetaMetrics®. NWEA collaborated with MetaMetrics on an algorithm that transforms students’ MAP Growth reading RIT scores to estimated Lexile® scores. You can use Lexile scores to select appropriate reading materials. Note about BR (Beginning Reader): the lower the number, the more advanced the reader’s abilities. |
| SEM | An estimate of the amount of error in an individual’s observed achievement score. The smaller the standard error, the more precise the achievement estimate. If the student were to retest soon, they’d likely score within the range defined by RIT +/- SEM. |
| Rapid-Guessing Percentage | Percent of questions the student answered in well below the average response time for the question—likely too quickly to truly engage with the item. If 30% or higher, NWEA recommends retesting. |
| Result type |
There are four result types: Official RIT score: A valid test result that is used to measure growth between two terms. Unofficial RIT score: A RIT score from a test event that isn’t used to measure growth between two terms. Produced in these situations: 1) screening test, 2) outside test window, 3) same test more than once (test with lowest SEM = official, others = unofficial). Invalid test: A test event with no score because it didn’t meet reliability standards. We recommend retesting. No test data: Test is paused, suspended, terminated, or not started. |
Exploring the Instructional Areas tab
Use the Instructional Areas tab to understand the strength and opportunity areas for your class and to explore class and student performance across instructional areas for the tests your students have taken.

Select the Instructional Areas tab at the top of the Class Profile report
Instructional Area Achievement Percentiles
The Instructional Areas Achievement Percentiles chart shows how your class performed for each instructional area.
Each row represents a distribution of achievement percentiles for an instructional area. You can use this chart to understand which instructional areas are relative strengths and areas for improvement for your class.
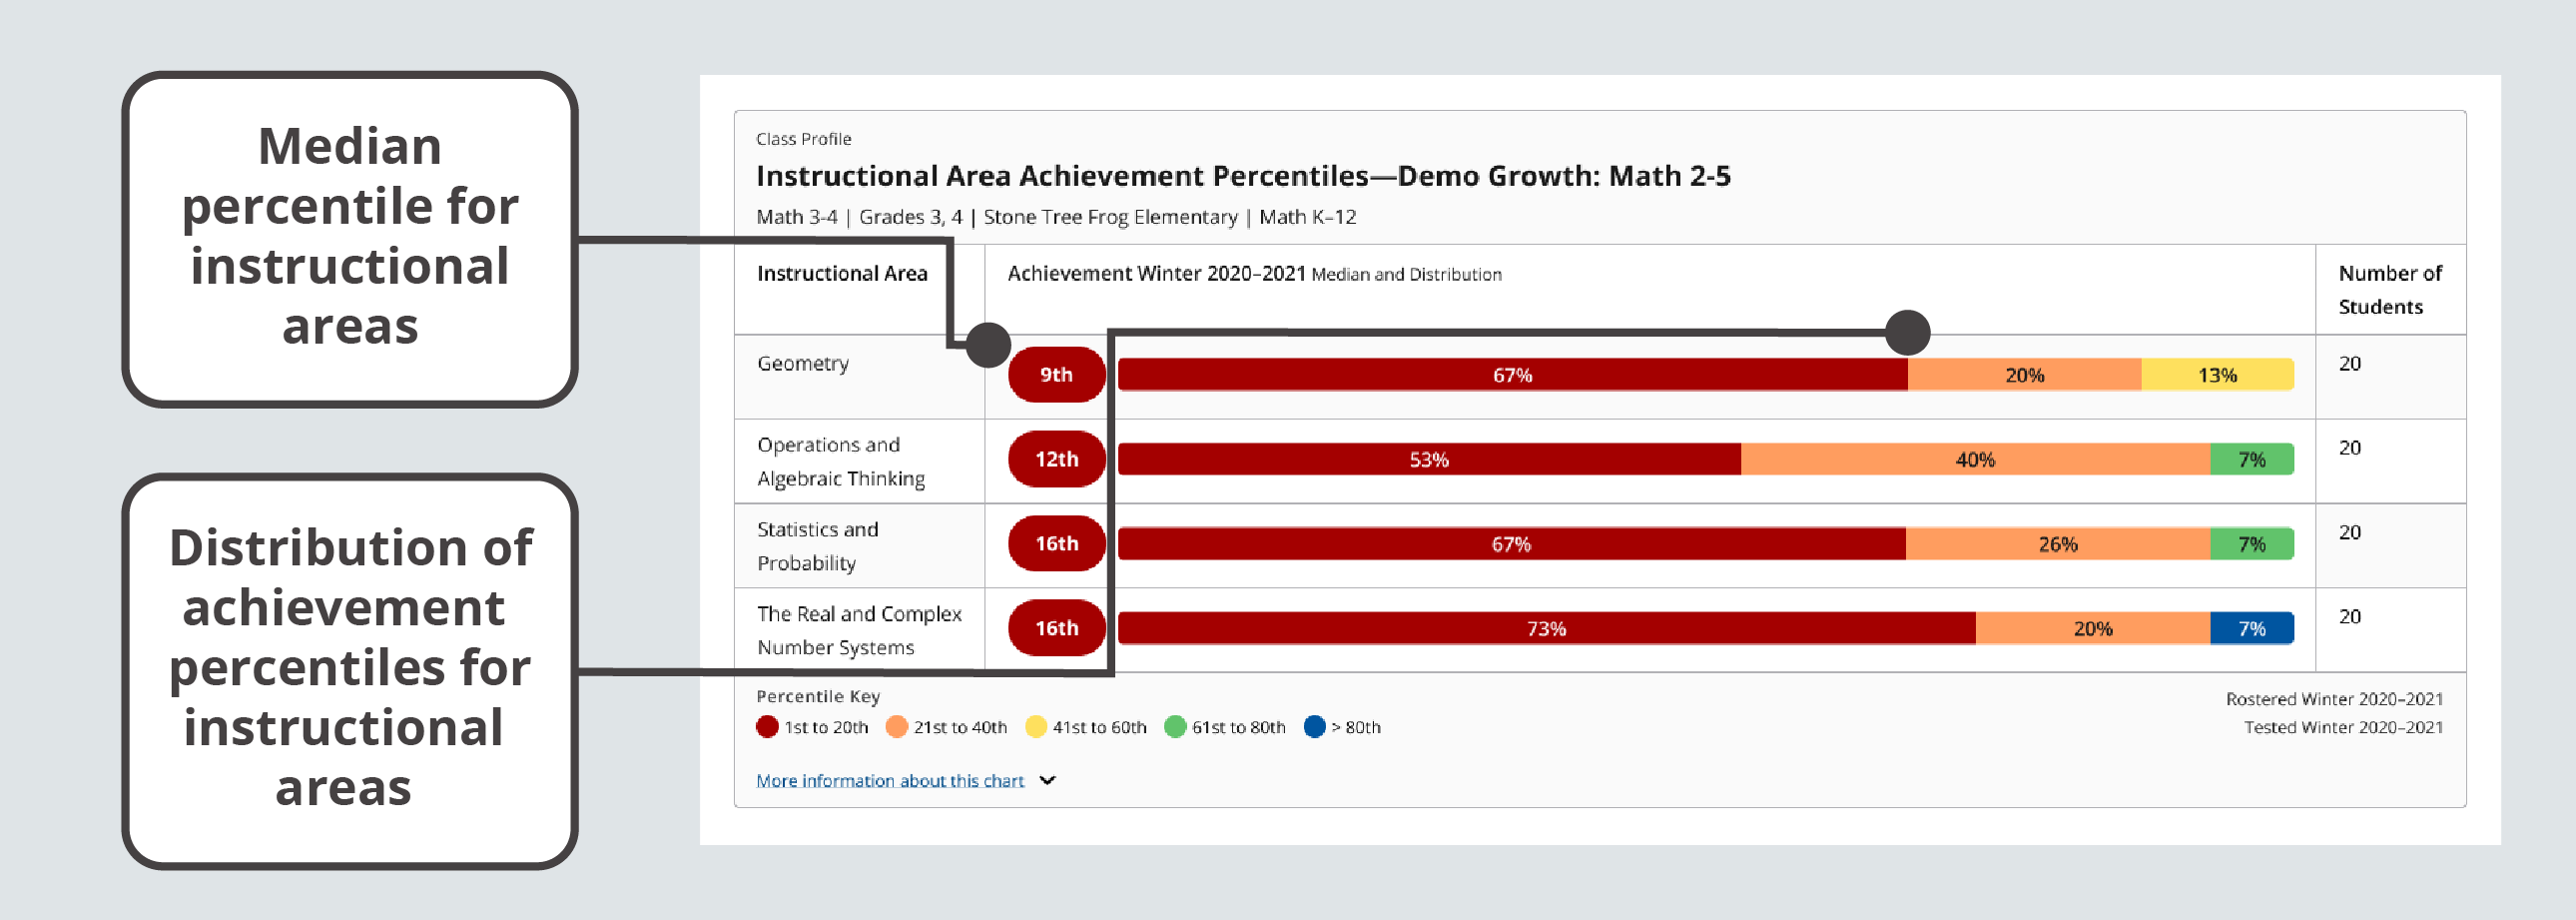
Instructional Area Achievement Percentiles module
| Data point | Explanation |
|---|---|
| Instructional areas | Reporting categories on MAP Growth reports that are aligned to standards or benchmarks. |
| Achievement Percentile | A percentile ranking based on MAP Growth Norms for achievement in one testing term. Percentiles are color coded by range as shown in the key. Percentiles for unofficial RIT scores appear in gray. |
| Distribution | A representation of the range of scores for a group of students, indicating the number and/or percentages of scores within five percentile levels, or quintiles. |
| Quintiles | Five percentile levels based on NWEA normative data: 1st–20th (red), 21st–40th (orange), 41st–60th (yellow), 61st–80th (green), and greater than 80th (blue). |
| Percentile | Norm-based information about where a student’s observed score falls within the range of scores produced by other same-grade US students. |
| Median Percentile |
The middle percentile value when a group of percentiles are ordered from lowest to highest. |
Students Grouped by Instructional Area Scores
The Students Grouped by Instructional Areas Scores chart shows you a distribution of student performance for an instructional area organized into 10-point ranges of RIT scores.
Each stack of students represents students who scored within a 10-point RIT range for the instructional area, giving you a sense of how alike or different each student in your class is across each subject's instructional areas. You can use this data as a starting point for forming temporary, flexible learning groups in your classroom.
To explore distributions for other instructional areas associated with the test, use the drop-down menu and select the instructional area you’d like to review.
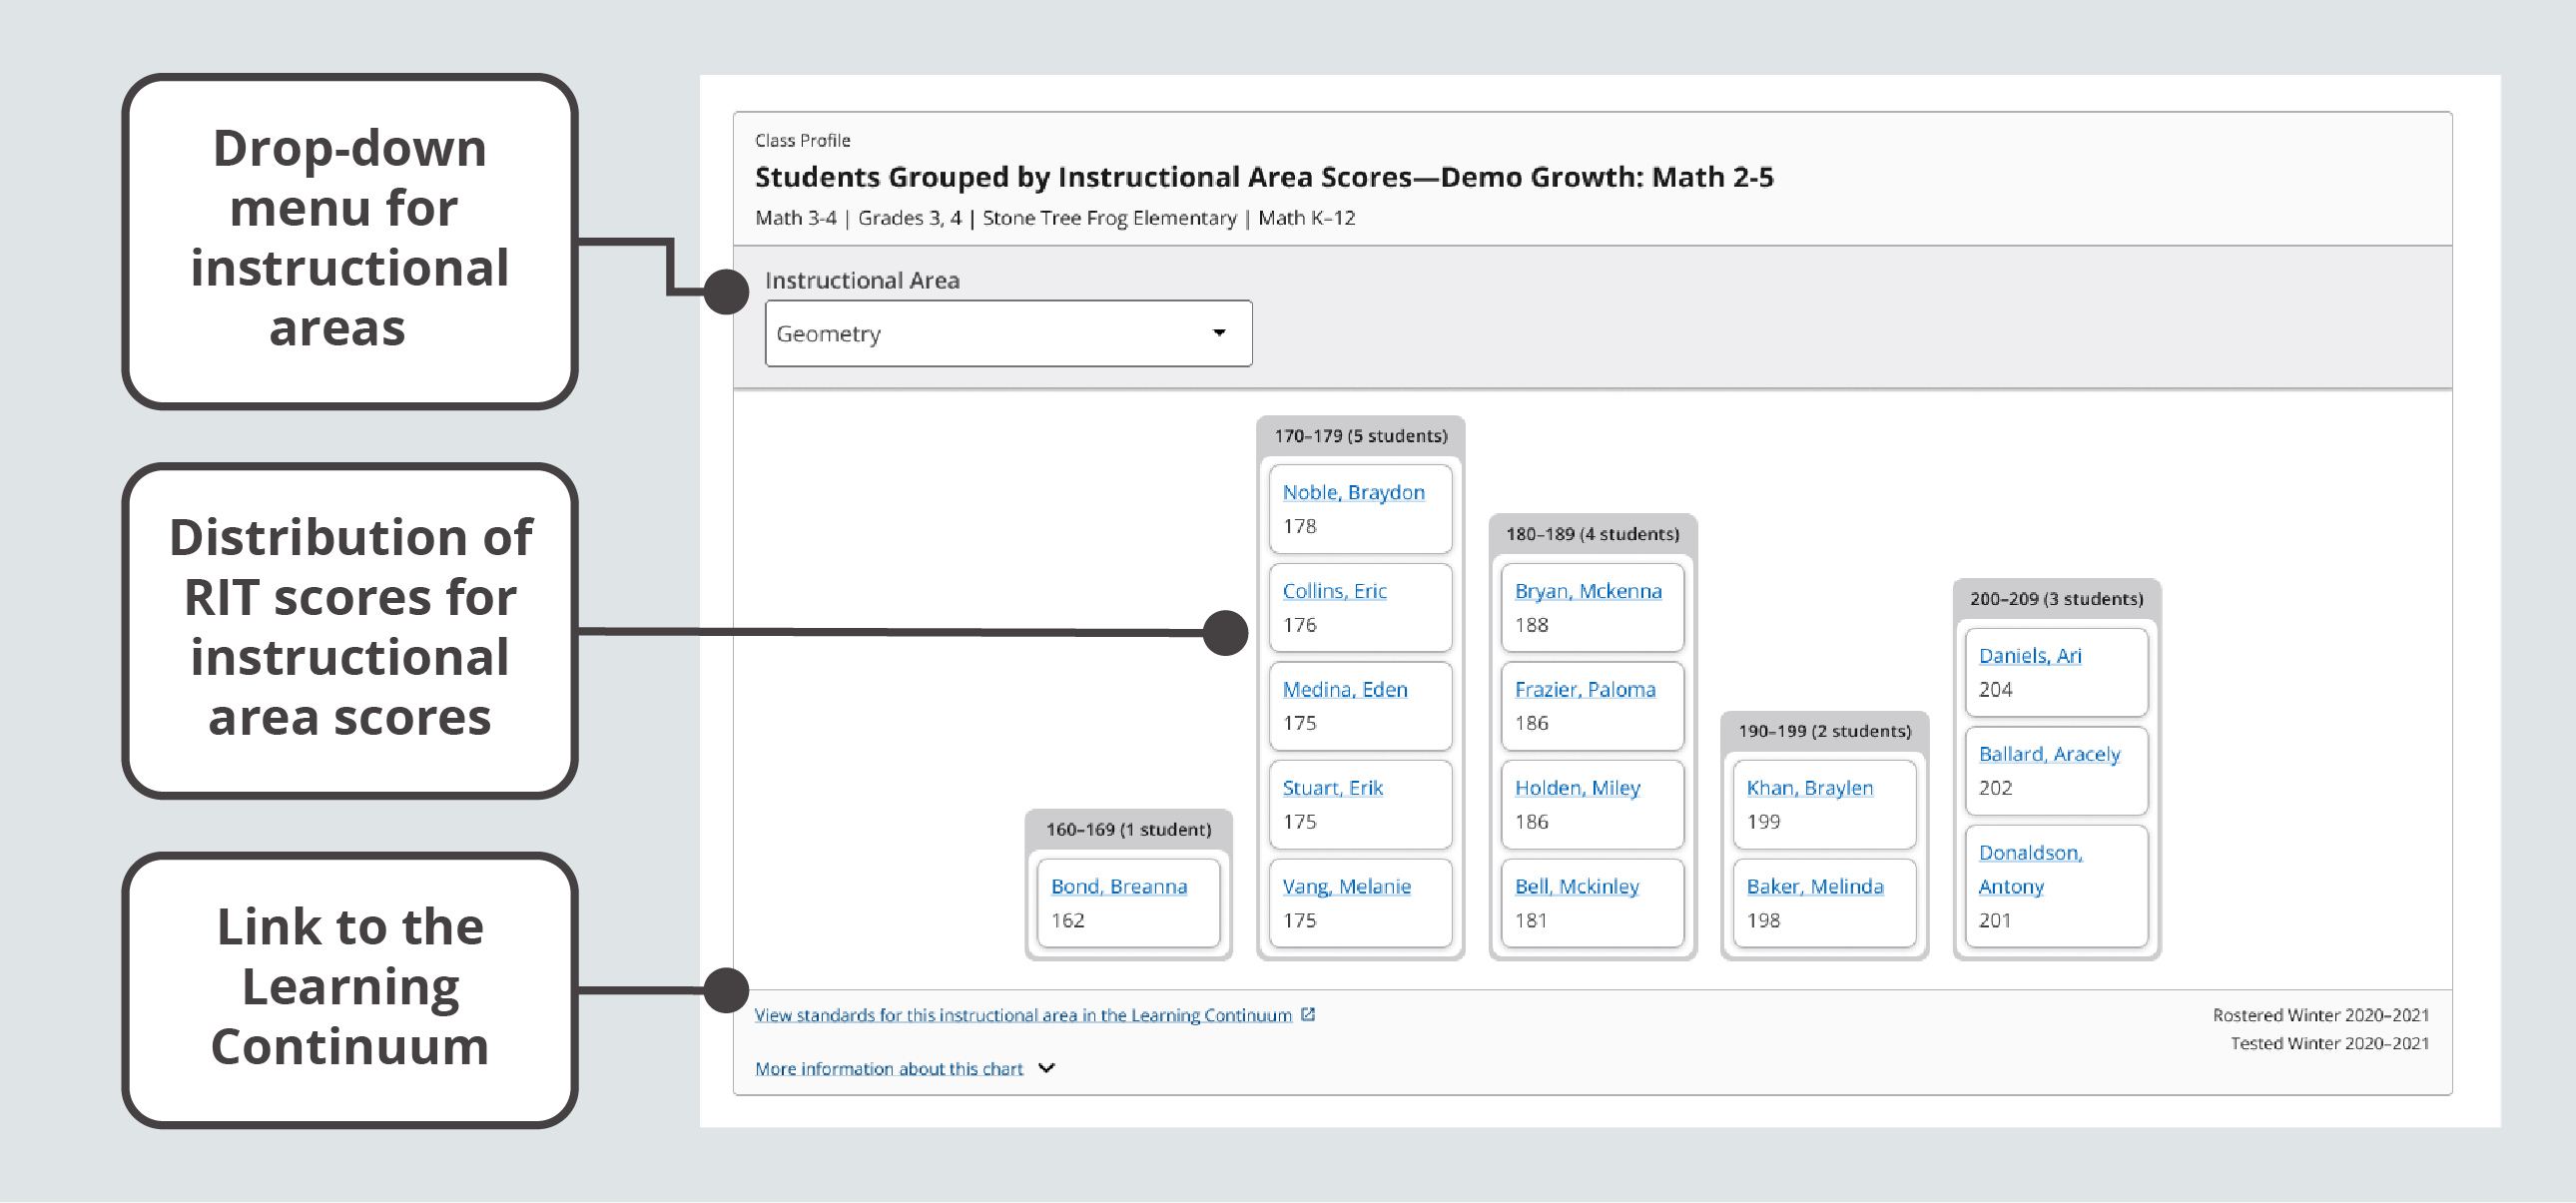
Students Grouped by Instructional Area Scores module
| Data point | Explanation |
|---|---|
| Instructional areas | Reporting categories on MAP Growth reports that are aligned to standards or benchmarks. |
| RIT band | A 10-point range of RIT scores. You can use the Learning Continuum to explore content associated with any RIT band. |
Instructional Area Details by Student
The Instructional Areas Details by Students table shows you a list of your students with details about the test(s) they’ve taken and the results(s) they’ve received across multiple instructional areas.
Each row represents a student and their performance on a particular test along with scores for each instructional area. You can sort the data by any of the column headers. In some instances, you can expand a row to find more information about a test result or find additional tests. You can use this chart to understand individual student performance.
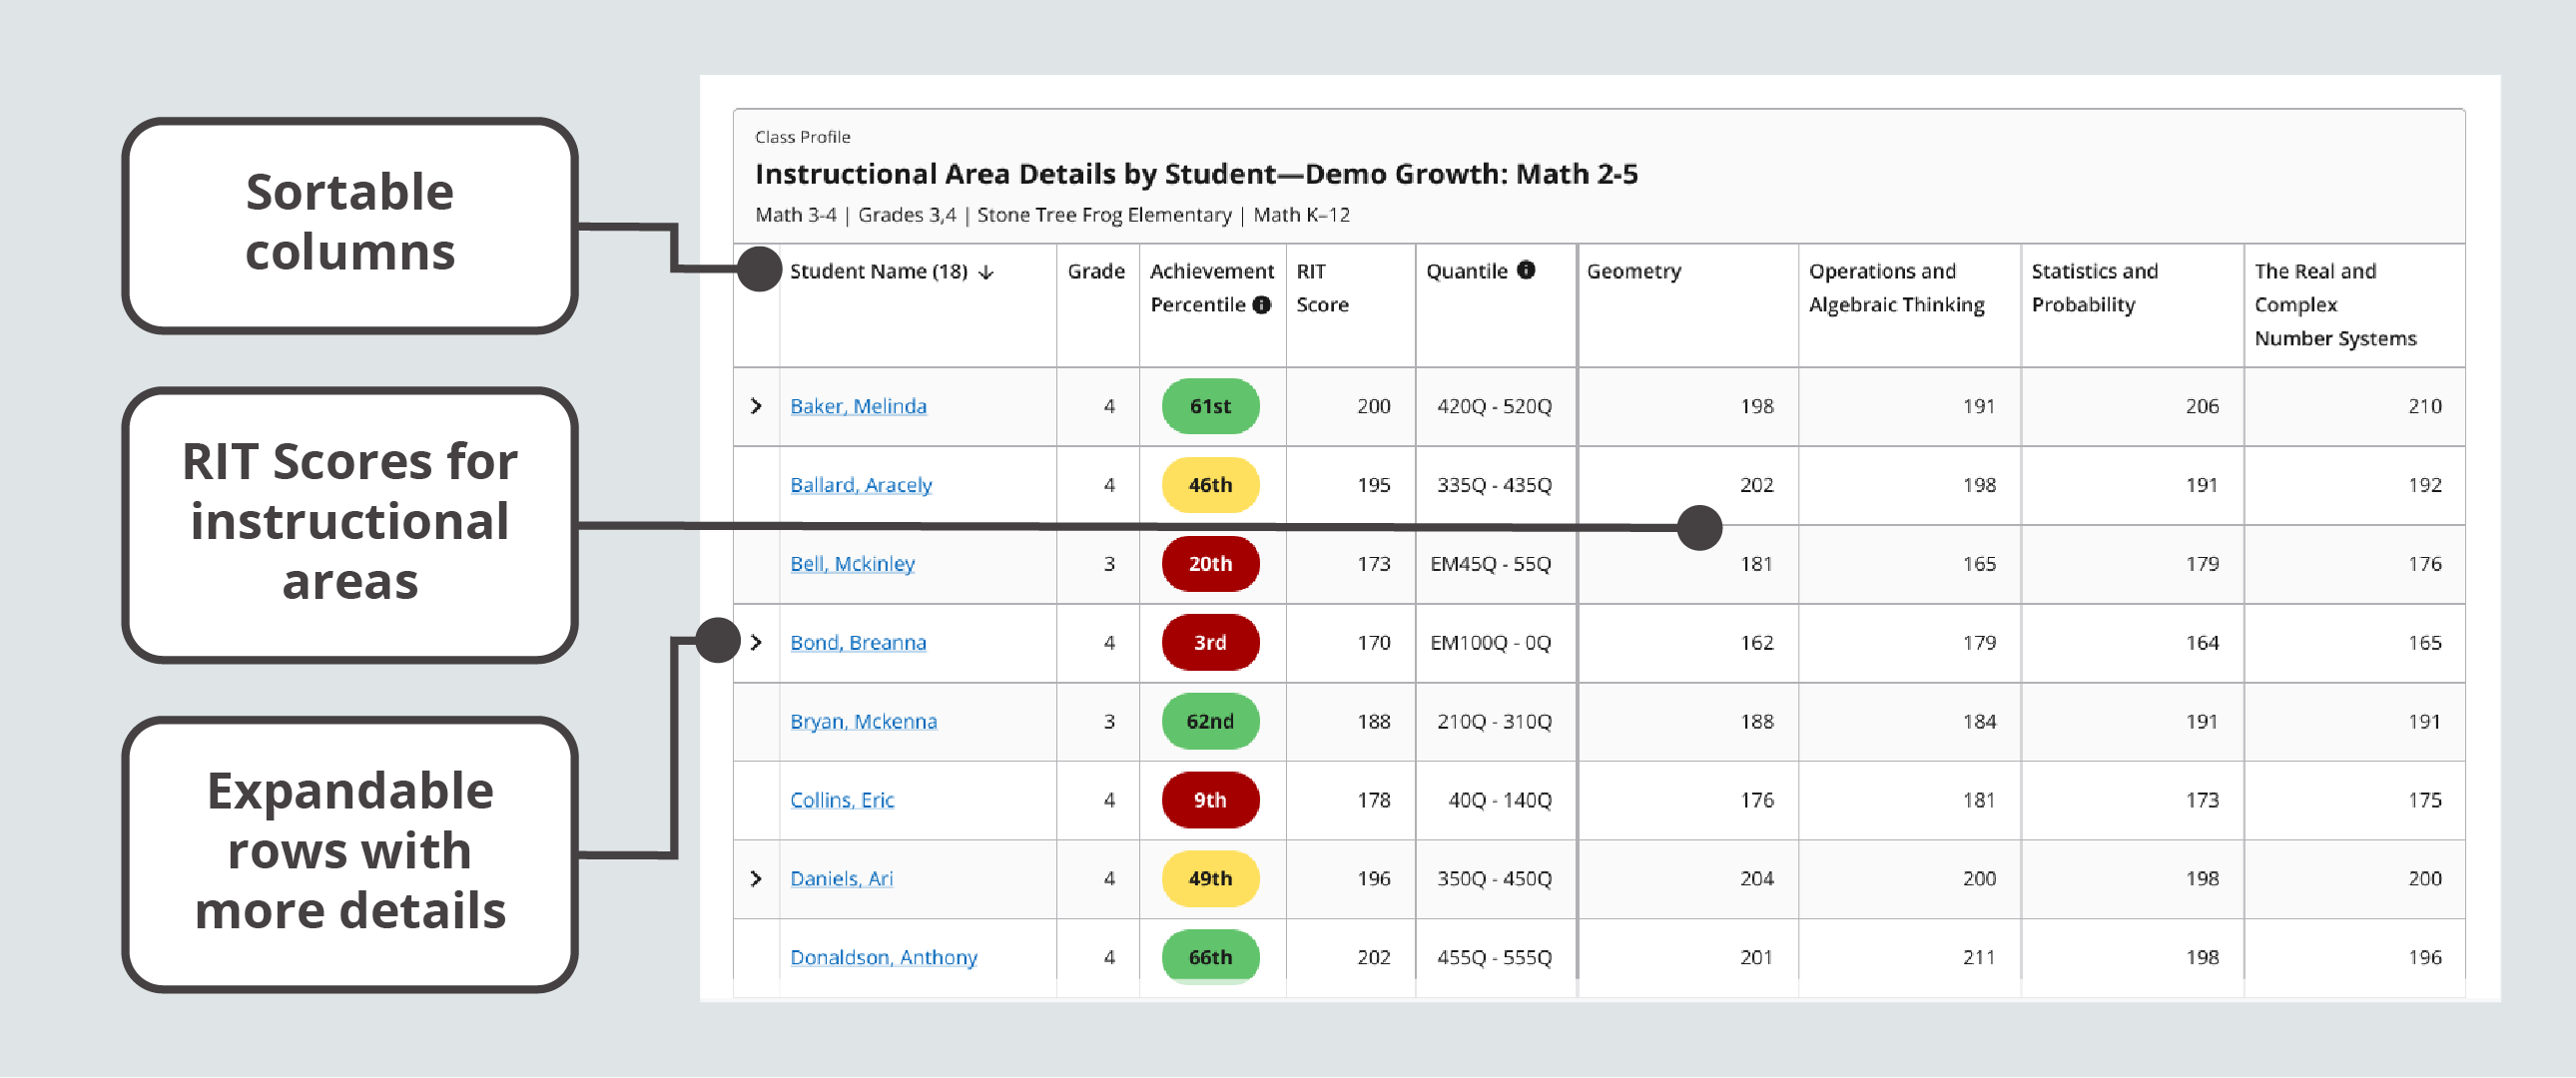
Instructional Area Details by Student module

Expanded row from the Instructional Area Details by Students table with multiple tests results

Expanded row from the Instructional Area Details by Students table with additional details for an invalid test
| Data point | Explanation |
|---|---|
| Achievement Percentile | A percentile ranking based on MAP Growth Norms for achievement in one testing term. Percentiles are color coded by range as shown in the key. Percentiles for unofficial RIT scores appear in gray. |
| Quintile | The Quantile Framework® for Mathematics, developed by MetaMetrics®, provides a nationally recognized measure aligned to MAP Growth math RIT scores. Quantile measures can help you find appropriate mathematical content for students. Note about EM (Emerging Mathematician): the lower the number, the more advanced the student’s abilities. |
| Lexile | The Lexile Framework® for Reading was developed by MetaMetrics®. NWEA collaborated with MetaMetrics on an algorithm that transforms students’ MAP Growth reading RIT scores to estimated Lexile® scores. You can use Lexile scores to select appropriate reading materials. Note about BR (Beginning Reader): the lower the number, the more advanced the reader’s abilities. |
| Result type |
There are four result types: Official RIT score: A valid test result that is used to measure growth between two terms. Unofficial RIT score: A RIT score from a test event that isn’t used to measure growth between two terms. Produced in these situations: 1) screening test, 2) outside test window, 3) same test more than once (test with lowest SEM = official, others = unofficial). Invalid test: A test event with no score because it didn’t meet reliability standards. We recommend retesting. No test data: Test is paused, suspended, terminated, or not started. |
Exploring the Projected Proficiency tab
You can use the Projected Proficiency tab to review how class and student MAP Growth scores project to performance on your state’s end-of-course summative tests, the ACT®, and the SAT®.

Select the Projected Proficiency tab at the top of the Class Profile report
Linking studies
You will find an additional selection field for Linking Study on this tab. Linking studies correlate MAP Growth scores with scores for end-of-course state summative assessments and college readiness assessments, allowing you to predict how a student might perform on these assessments based on their MAP Growth performance.
For more information about linking studies, see What is a linking study and where can I find it?.
To choose a linking study:
-
Review the prepopulated value for Linking Study and change the selection as needed.

Review the value and change the selection as needed
-
Select Update and review the results.
About proficiency projections
As you review the data on this tab, keep in mind the following details:
-
There are no projections available from MAP Growth summer test results
-
Which state and college projections appear depends on the state alignment that your district selected during MAP implementation
-
If your state does not have a specific NWEA linking study for its end-of-course summative assessments, the NWEA Default Linking study will be available instead; for more information, review the Default Linking Study article
-
Depending on the state, projections may be limited to certain subjects (typically reading and math) and certain grades (typically 2 through 8)
-
College readiness projections are limited to grades 5 through 9
Projected Proficiency Overview
The Projected Proficiency Overview chart shows a distribution of projections for each student in your class.
Projections are organized into proficiency categories based on cut scores defined in the selected linking study. You can use this visualization to understand how your whole class is projected to perform on an end-of-course state summative assessment or college readiness assessment.
If your class includes students in multiple grades, this chart will still display your class data in a single visualization, giving you a holistic sense of how all your students are projected to perform.
The Projected Proficiency Overview chart also provides a short statement of how most of your class is expected to perform. This offers you a quick data point for the overall projected proficiency of your class.

Projected Proficiency module
| Data point | Explanation |
|---|---|
| Projection | A prediction of how a student is expected to perform. |
| Proficient | Meeting grade-level expectations for a state summative assessment or a college readiness assessment. |
| Linking study | A study that correlates MAP Growth scores with scores for a state summative assessment or a college readiness assessment. |
| Cut scores | Scores that correspond to various proficiency categories. |
| Proficiency Category | A range of RIT scores that describes a student's projection to a defined proficiency level. |
About Spring Cut Scores
The About Spring Cut Scores chart lists the RIT score ranges and proficiency categories of the selected linking study for each grade in your class.
You can use this information as a reference for understanding your students’ projected proficiency.

About Spring Cut Scores module
| Data point | Explanation |
|---|---|
| Linking study | A study that correlates MAP Growth scores with scores for a state summative assessment or a college readiness assessment. |
| Cut Scores | Scores that correspond to various proficiency categories. |
| Proficient | Meeting grade-level expectations for a state summative assessment or a college readiness assessment. |
| Proficiency category | A range of RIT scores that describes a student's projection to a defined proficiency level. |
Projected Proficiency by Student
The Projected Proficiency by Student table shows you a list of your students with details about their current RIT scores and projected performance.
Each row represents a student’s RIT score from the selected term tested, their projected RIT score for the spring term (when applicable), and their projected proficiency category for the associated state summative assessment or college readiness assessment. You can sort the data by any of the column headers.
You can use this chart to understand projected proficiency for individual students in your class.
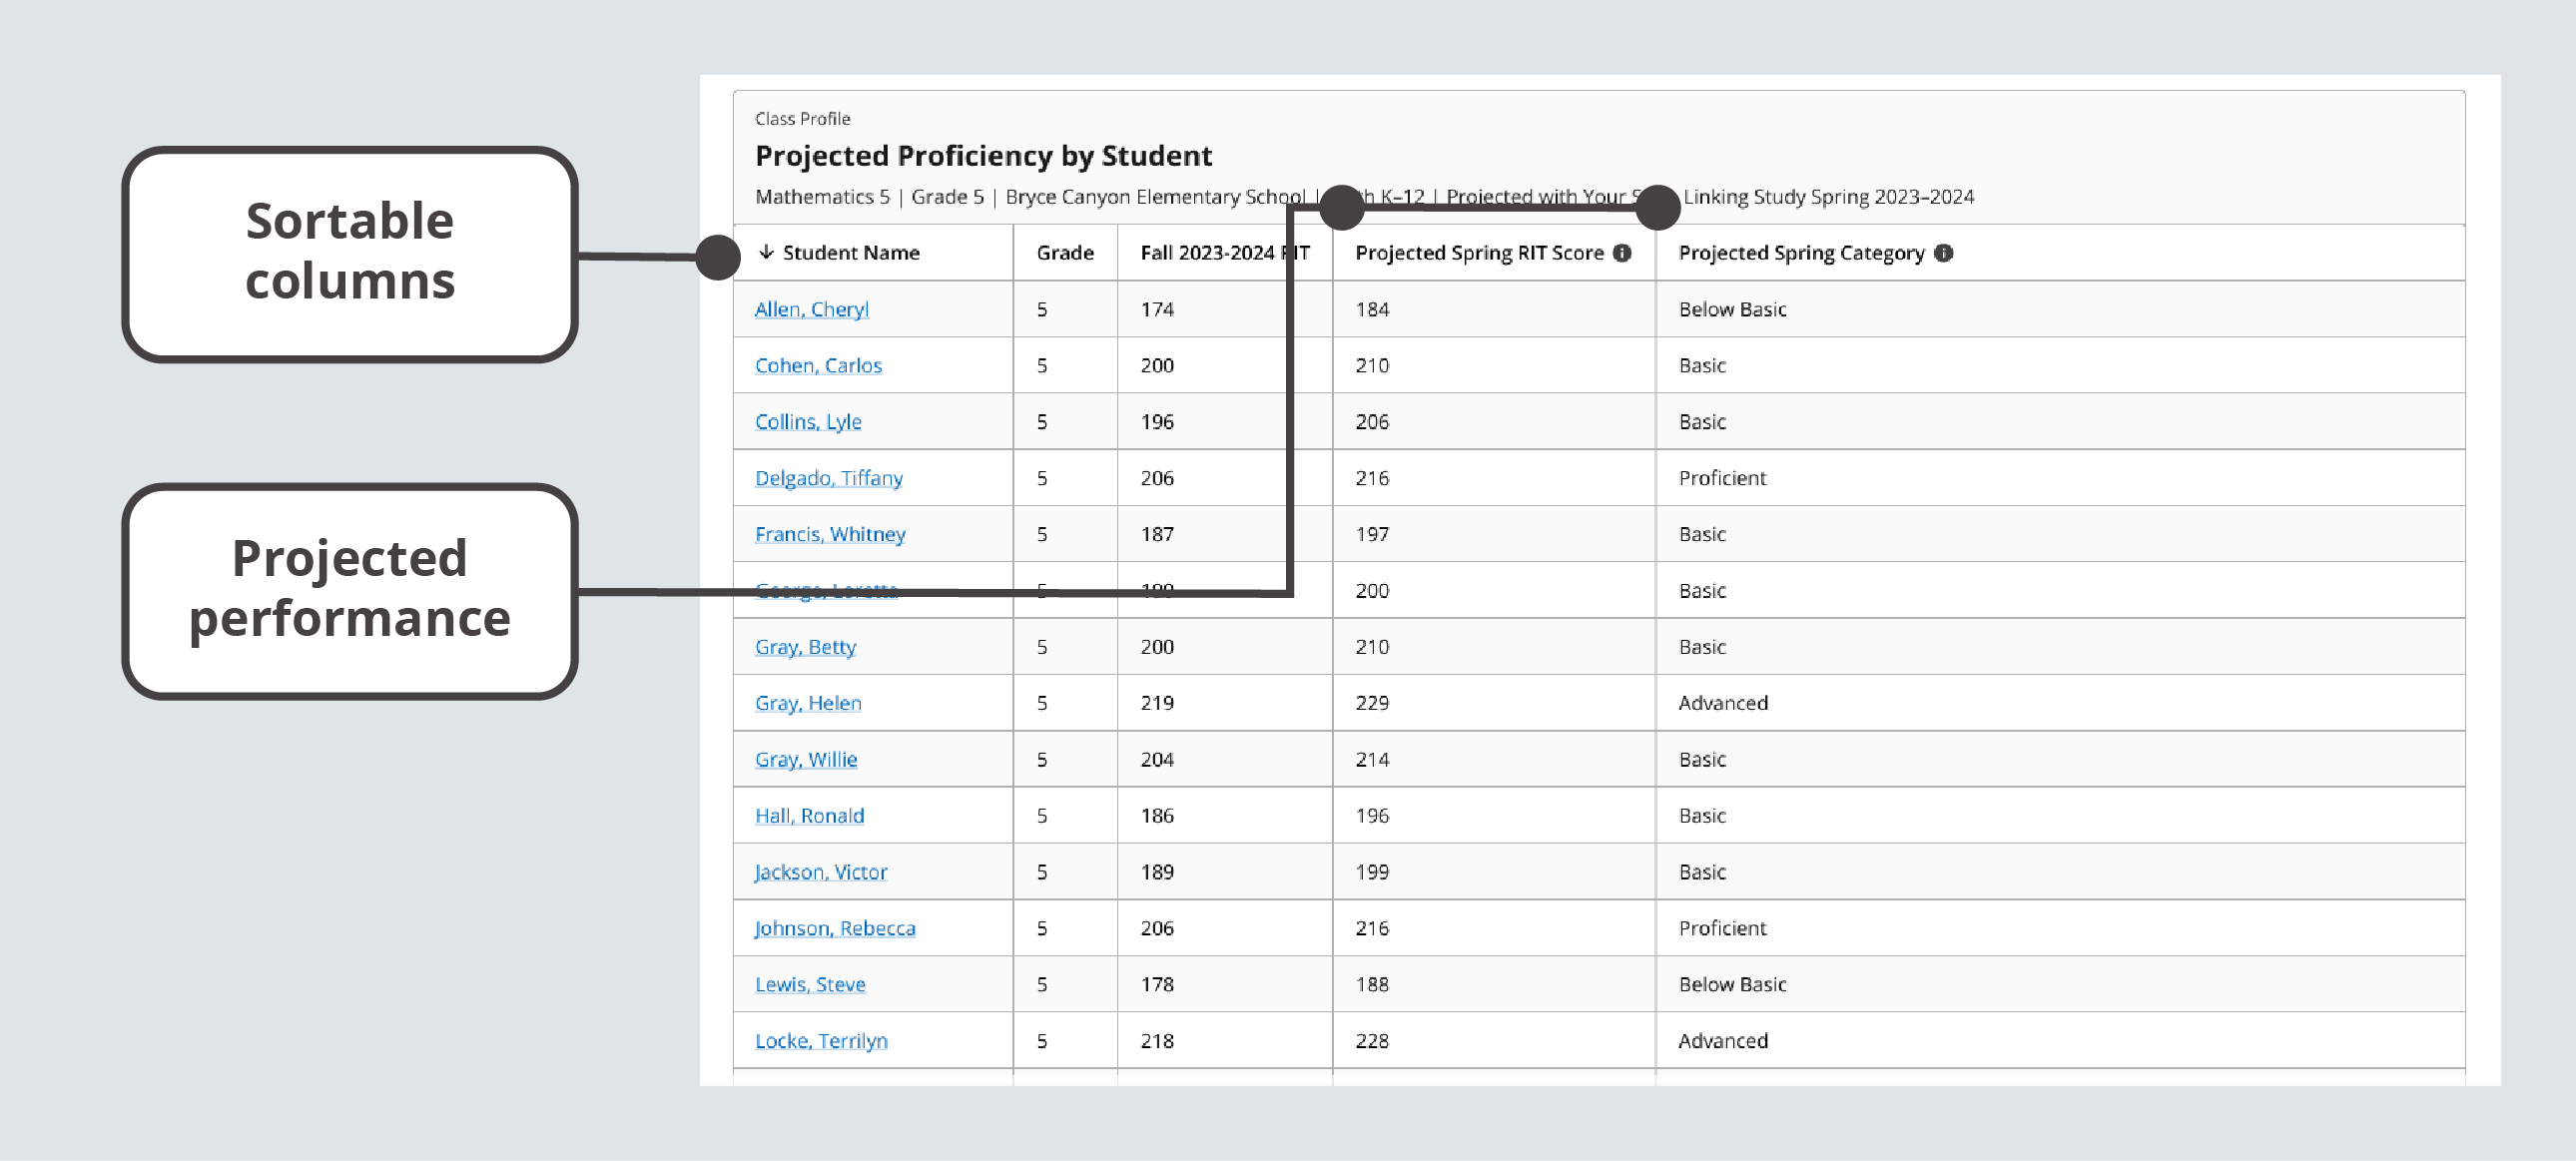
Projected Proficiency by Student module
| Data point | Explanation |
|---|---|
| Projected Spring RIT Score |
Expected MAP Growth RIT score for Spring term. This column will only display when Term Tested is set to a fall or winter term. |
| Projected Spring Category | Expected proficiency category for the assessment associated with the selected linking study. |
Applying insights
The Class Profile report streamlines access to information through intuitive visuals, empowering educators to interact with data seamlessly to make more informed instructional decisions and save valuable time. Explore the ideas below for when to use this report and the kinds of questions it can help you answer.
When to use the Class Profile report
Consider using the report at these times:
-
After testing, to see achievement data and test details
-
As part of the instructional decision-making process
-
When you want to use data to inform student grouping
-
Before your test window closes so that you can wrap up any retakes or test completions
How to use Class Profile report
The Class Profile report can help you answer these questions:
-
How is my class doing overall?
-
What is the academic diversity of my class?
-
What is our lowest instructional area? Our highest?
-
How are we performing compared to national norms?
-
What is the Lexile reading range/Quantile mathematics range for my students and my class materials? What adjustments might be needed?
-
How much time did each of my students take on the test?
-
Which students haven't completed tests?
-
Which students may need to take the test again?
-
How many RIT bands are represented within my class?
-
How can I group my students by similar achievement levels?
-
How will I need to scaffold my instruction for each group of students?
-
How might my grouping strategy change within each instructional area?
-
How are individual students projected to perform on the state summative assessment? How about the college and career readiness assessments?
-
Are any of my students’ scores close to the higher/lower proficiency categories?
