–See Other Student Level Reports–

Student Profile Report


Description

Brings together the data you need to advise each student and support their growth

Applicable tests MAP Growth and MAP Growth K–2 (not Screening tests)

Required roles

Instructor, Administrator, or Assessment Coordinator (School or District)

Date limits

All years before, for tests completed within your test window range (set under Manage Terms)

How Can I Help My Learners Leverage Their MAP Data? Using the Student Profile Report (8–10 min)

Basic Use

As you get started, follow these tips.

  • Browser recommendation: Avoid using Internet Explorer® and Safari® 8, because of slow performance. Chrome™ performs the best. If needed, try clicking refresh: .
  • Prerequisite: Your school or district should have correctly set the Weeks of Instruction between testing, under MAP preferences. This setting specifies the average amount of instruction your students received, so it determines how they align to students in the NWEA norms study.
  • Quick access: To jump straight to a specific student, open View Reports > MAP Reports, and use the Student Quick Search.

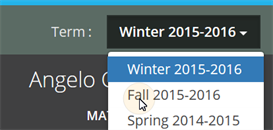
  • View prior test data: You can choose previous terms from the menu at top:

    The default—Most Recent—means the most recent term with test data, which could differ for each subject. To alert you when the most recent score comes from a prior term, an asterisk appears next to the subject score.

  • Change student, class, or term rostered: There are various ways to switch to a different student:

  • Percentile colors: Wherever you see color coding, it indicates the percentile (a percentage-based ranking) of the achievement your student reached. It compares your student with students in the NWEA norms study from the same grade and with the same weeks of instruction between testing (as specified in your MAP preferences).

Printing

For family conferences and other meetings, you can quickly prepare printed reports for all students or a selection. While viewing any student in the Student Profile report, click Print and Share, and then Batch PDF:

Tip: The Family Report provides the best choice for conferences. See Family Report.

There are many choices you can explore, including which students to print: 
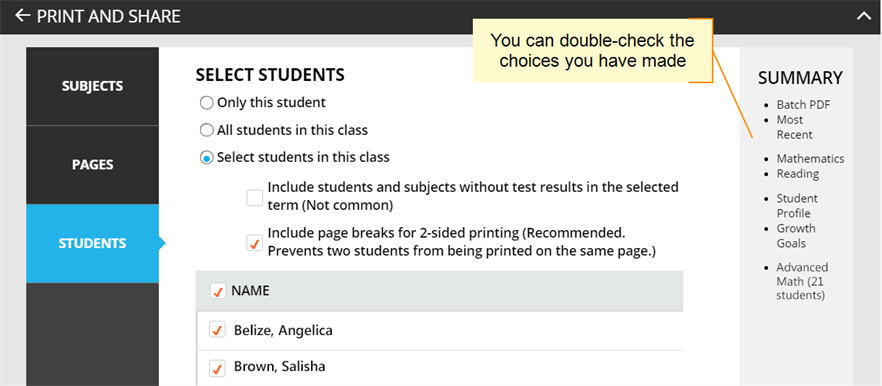
Caution: Under Pages, the Instructional Areas option uses a large amount of paper. For each student, it prints all of the “ready to DEVELOP” learning statements in all areas.


Subject Scores

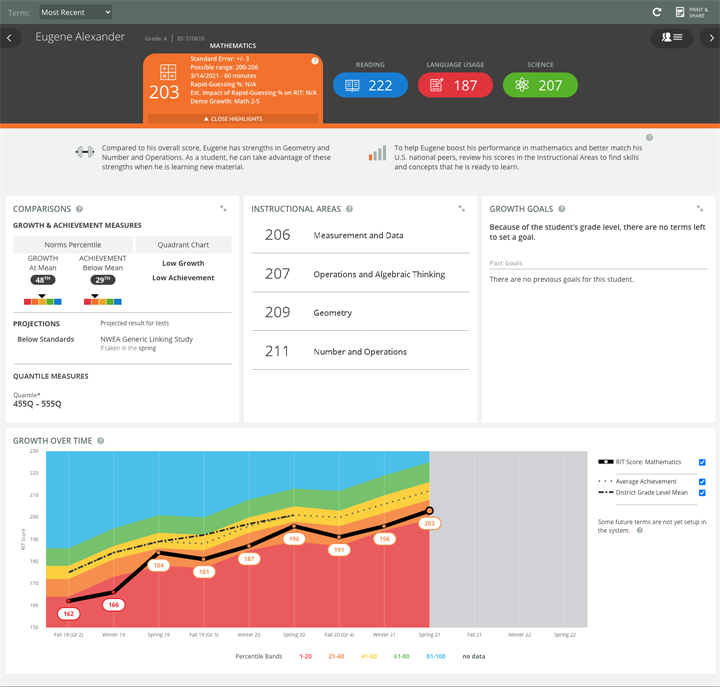
The overall RIT score appears in each subject tab, along with important test details to qualify this test result:

Standard Error and Possible range: Show an estimate of the measurement precision. If retested soon after, the student’s score would be within this range most of the time.

Minutes:  Total of the minutes a student took to complete all test questions (excludes any test interruptions). For a comparison of typical test times, see Average Test Durations.

Rapid-Guessing %: A rapid guess means the student answered well below the average response time measured by NWEA for each test question. The response is so fast that the student could not have viewed the question completely. If N/A appears, it means no rapid guessing was detected for that test.

Note for partners who view MAP Growth information from state assessments: Rapid-guessing information is not available for assessment data derived from state assessments.

Estimated Impact: Shows how different the score would have been if the student had been fully engaged during the test. For example, with a RIT score of 210 and an Estimated Impact of -3, it means the student might have scored 213. Occasionally, you might see a positive Estimated Impact, which means the score probably exaggerates the student’s capabilities, as a result of correct guesses.

Note: If a student takes both a course-specific test (such as Algebra I) and a general subject test (such as Math 6+) in the same test window, only the most recent test appears in this report.

Highlight Recommendations

In the Highlights section, you can review a summary and recommendations for the most recent test results (if needed, change the Term to Most Recent):

This information also appears in the printed report as part of the profile overview page.

Comparisons

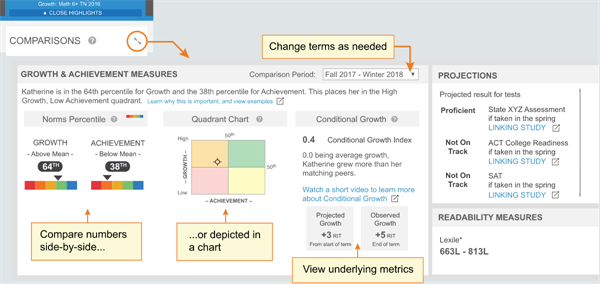
The Comparisons section enables you to put the MAP Growth score into a meaningful context. You can connect the student’s score with other measures to answer various questions:

  • How well is my student growing?
  • How will my student perform on state or college exams?
  • What reading level does my student need?

To see the full view, click the expansion arrows:

Growth Examples

Consider a student who does well in math, but not in reading. There could be more to the story when you compare the Achievement to Growth.

High Growth: Although the student’s reading Achievement score was below average for Reading, you could offer encouragement by focusing on the above-average growth shown. With continued growth, this student can catch up with peers.


Low Growth: After congratulating this student on a great Achievement score for Math, you could ask about the below-average growth and suggest more challenges to keep the student growing to potential.

Growth Details

For a closer look into growth calculations, refer to the following measurements in the expanded view:

Conditional Growth Index: This statistic underlies the Growth Percentile (see the following explanation video). It relates your student’s growth to the growth patterns of matching peers within the NWEA norms study (same grade, starting RIT score, and Weeks of Instruction before testing). In addition, this measurement involves a conditioning process that incorporates how difficult it was for each student to grow.

A value of zero (0) corresponds to the mean (typical) growth, indicating that growth exactly matched projections. Values above zero indicate growth that exceeded projections, and values below zero indicate growth below projections.

Projected Growth: Shows the number of RIT points your student was expected to grow between the Comparison Period, based on the growth of matching peers in the NWEA norms study.

Observed Growth: Shows the actual RIT point difference between the start and end term of the Comparison Period. Comparing Observed and Projected Growth provides a simple confirmation of the other growth insights.

Conditional Growth Explanation

Projection Details

The projections for state and college exams have some qualifications:

  • There are no projections available from summer test results.
  • Which state and college projections appear depends on the state alignment that your district selected during MAP implementation.
  • If your state does not have a specific NWEA linking study, default projections developed by NWEA appear on the report.
  • Depending on the state, projections could be limited to certain subjects (typically reading and math) and certain grades (typically 2 through 8).
    • College readiness projections are limited to grades 5 through 9 (SAT®) and 10 (ACT).
  • To make projections, the report follows these steps:
    • Uses NWEA norms to estimate growth to the term when the state or college assessment typically occurs.
    • Uses the NWEA linking study to correlate that projected RIT score to an estimated proficiency.
  • ACT College Readiness: The “On Track 24” projection is the highest benchmark. It is based on a more stringent ACT® cut score of 24, instead of 22.

Readability Measure

The Lexile® measure is an estimate based on your student’s RIT score. The Lexile measure reflects word frequency (semantics) and sentence length. Use it to choose appropriate reading material. Find books at Lexile.com. Lexile is a trademark of MetaMetrics®, Inc.

Quantile Measure

The Quantile® Framework is a mathematics measurement framework developed by MetaMetrics. It is a nationally recognized mathematics score aligned to the NWEA math RIT score. Similar to the MetaMetrics Lexile score, the Quantile score helps educators understand the difficulty of specific mathematical skills and concepts on a single developmental scale. You can use the Quantile Framework for Mathematics to match students with classroom materials.

To learn more, visit Use Quantile Measurements.

Quantile and Metametrics are trademarks of MetaMetrics, Inc., and are registered in the United States and abroad.

Instructional Areas

In the Instructional Areas section, you can see the component parts of the assessment. Lower scores appear near the top so that you can suggest where to focus efforts, and higher scores appear near the bottom so that you can celebrate your student’s strengths.

Note: Formerly known as “goal performance scores”, instructional area scores appear on existing reports, such as Class Profile report, Student Progress report, Grade report, and others. Key differences:

  • Range of scores: Instead of a range representing the Standard Error, only the middle score of that range appears here. However, you can see the +/- Standard Error when you click an instructional area to open the details.
  • Low/high percentiles: Instead of comparing scores with NWEA norms, the scores are compared with the overall score and, in some cases, designated “Area of Focus” or “Relative Strength.”

Note: Instructional area categories may be labeled differently depending on your test version or state assessment.

Note for partners who view MAP Growth information from state assessments: Due to state summative test designs, learning statements are not available for state assessments.

About Suggested Area of Focus/Relative Strength

You may see some areas labeled Relative Strength or Suggested Area of Focus. These labels help you pinpoint how the student performed relative to the subject overall. Here is how the report designates each area:

  • Takes the difference between the instructional area score and subject score
  • Adjusts for the Standard Error in both scores:

    • If the adjusted difference is positive, the area is labeled Relative Strength
    • If the adjusted difference is negative, the area is labeled Suggested Area of Focus

    • If the difference is within the Standard Error, there is no label
    Where is the Standard Error shown? For the subject, look in the main tab. For an instructional area, open the detailed, expanded view.


Growth Over Time

At the bottom of the page, you can see all historical, longitudinal data for a student:

To see further back

Scroll up and change the Term menu, above the student name. If you choose Most Recent, the graph adjusts to the current calendar term.

Definitions for Growth Over Time

  See also: Percentile Colors

Goal: If you have set future growth goals in the Growth Goals section, they appear here. If not, no goals appear on the graph. For prior terms, it is a gauge of how well your student met the goals you set together. For future terms, it helps to show the direction you have set.

Projected Score: This projection is based on your student’s actual RIT score in a previous term, plus the typical RIT growth of matching peers within the NWEA norms study. Matching peers have the same prior RIT score, as well as the same grade and weeks of instruction between testing (as specified in your MAP Growth preferences). Using matching peers provides a fair comparison, so it is reasonable for your student to meet the projection and even grow beyond it.

Average Achievement: Shows the average score (50th percentile) for all applicable students within the NWEA norms study. Students within the norms study have the same grade and weeks of instruction between testing (as specified in your MAP Growth preferences).

District Grade Level Mean: Shows the average score for students within your district who were in the same grade and who tested in the same term.

If it doesn't appear in a given term, the district testing window is not yet closed. Contact a team leader to close the testing window, and then wait for overnight processing.

Linking Study (Cut Scores): If applicable, you can see your student’s projected performance on state or college readiness assessments. Bars showing the cut scores are hidden by default, so use the check box on the right to display it.


Gray background—When there is no data, a gray background appears. Examples include: no completed test event, student not enrolled, or no norms study (12th grade Language Usage and 11–12th grade Science).


Growth Goals

For an upcoming term, you can create a growth or performance target for each student. Later, return to see if the student met the goal.

  1. From the main Student Profile page, click the expansion arrows:

  2. Consider the Tips for Setting Growth Goals (below).
  3. Set a goal by making an entry and then clicking outside the box:
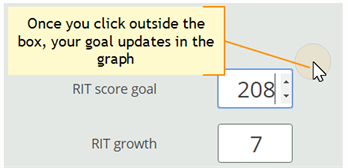
    Use any of the goal numbers—the other numbers adjust to match your entry.

    Note: The RIT Growth and Growth Percentile entries are not available if there is no recent test score to form the basis of growth.

  4. As a best practice, type an Action Plan for future reference.

  5. Click Set Goals to save your change.

    After a moment, the goal appears in a row at the top. If needed, you can delete it, or overwrite it by setting a new goal.

Tips for Setting Growth Goals

General assumption: Your school or district has correctly set the Weeks of Instruction between testing, under MAP preferences. It forms the basis for much of the percentiles and projections shown.

For background information on growth, seeGrowth and Norms.

  1. Strike a balance: 
    • Challenge your student: To advance academically, students should strive to go beyond the typical scores.
    • Be realistic: Consider past performance so the goal fits your student’s capabilities.
  2. How many RIT Growth points are reasonable?
    • By default, growth is set to the Projected Growth, if available. This growth projection is personalized to your student, because it is based on matching peers from NWEA norms (same prior RIT score, grade, and weeks of instruction between testing).
      • Using matching peers provides a fair comparison, because students with high starting achievement generally do not grow as much as students with low achievement.
      • Projected Growth is the midpoint for these peers (half grew more and half grew less).
    • This score is an initial suggestion—you might target above or below it, depending on other considerations.
    • In contrast, the Average Achievement (bottom left) shows you how all students typically perform within the same grade and same weeks of instruction between testing. It is simply the average score (50th percentile) for the target term.
  3. Which of the percentile bands (rainbow colors) should your student target?
    • Percentiles compare your student with students in the NWEA norms study from the same grade and with the same weeks of instruction between testing.
    • For example, suppose your student is hovering just below the orange percentile band, and you want to encourage the student to reach the next band. Try setting Achievement Percentile to the low 40s, which is the cutoff for that percentile.

    • Next, consider Growth Percentile, if available. It shows the level of growth your student would have to show in order to reach the Achievement Percentile. Higher growth numbers mean a greater challenge.

      How Growth Percentile is calculated: This measurement ranks each student’s growth among the levels of growth observed across all matching peers within the NWEA norms study (same prior RIT score, grade, and weeks of instruction between testing).

  4. If available, consider the growth needed to reach an ideal cut score on state or college assessments. To display cut scores, select the options below the graph:

    • There are no projections available from summer test results.
    • Which state and college projections appear depends on the state alignment that your district selected during MAP implementation.
    • If your state does not have a specific NWEA linking study, default projections developed by NWEA appear on the report.
    • Depending on the state, projections could be limited to certain subjects (typically reading and math) and certain grades (typically 2 through 8).
      • College readiness projections are limited to grades 5 through 9 (SAT®) and 10 (ACT).
    • To make projections, the report follows these steps:
      • Uses NWEA norms to estimate growth to the term when the state or college assessment typically occurs.
      • Uses the NWEA linking study to correlate that projected RIT score to an estimated proficiency.
    • ACT College Readiness: The “On Track 24” projection is the highest benchmark. It is based on a more stringent ACT® cut score of 24, instead of 22.