
More help:
NWEA Support
Have an idea?
Share it!
–See Other School or District Level Reports–
Welcome to the School Profile report! You can use this report to quickly compare and track trends, identify classes that need additional support, evaluate results of major changes, and more.
Contents
Getting started
In this section you'll learn what the School Profile report offers you and how you can access it.
School Profile Report Video Tour (10 min.)
Feature overview
Explore your school’s data with the interactive features highlighted below.
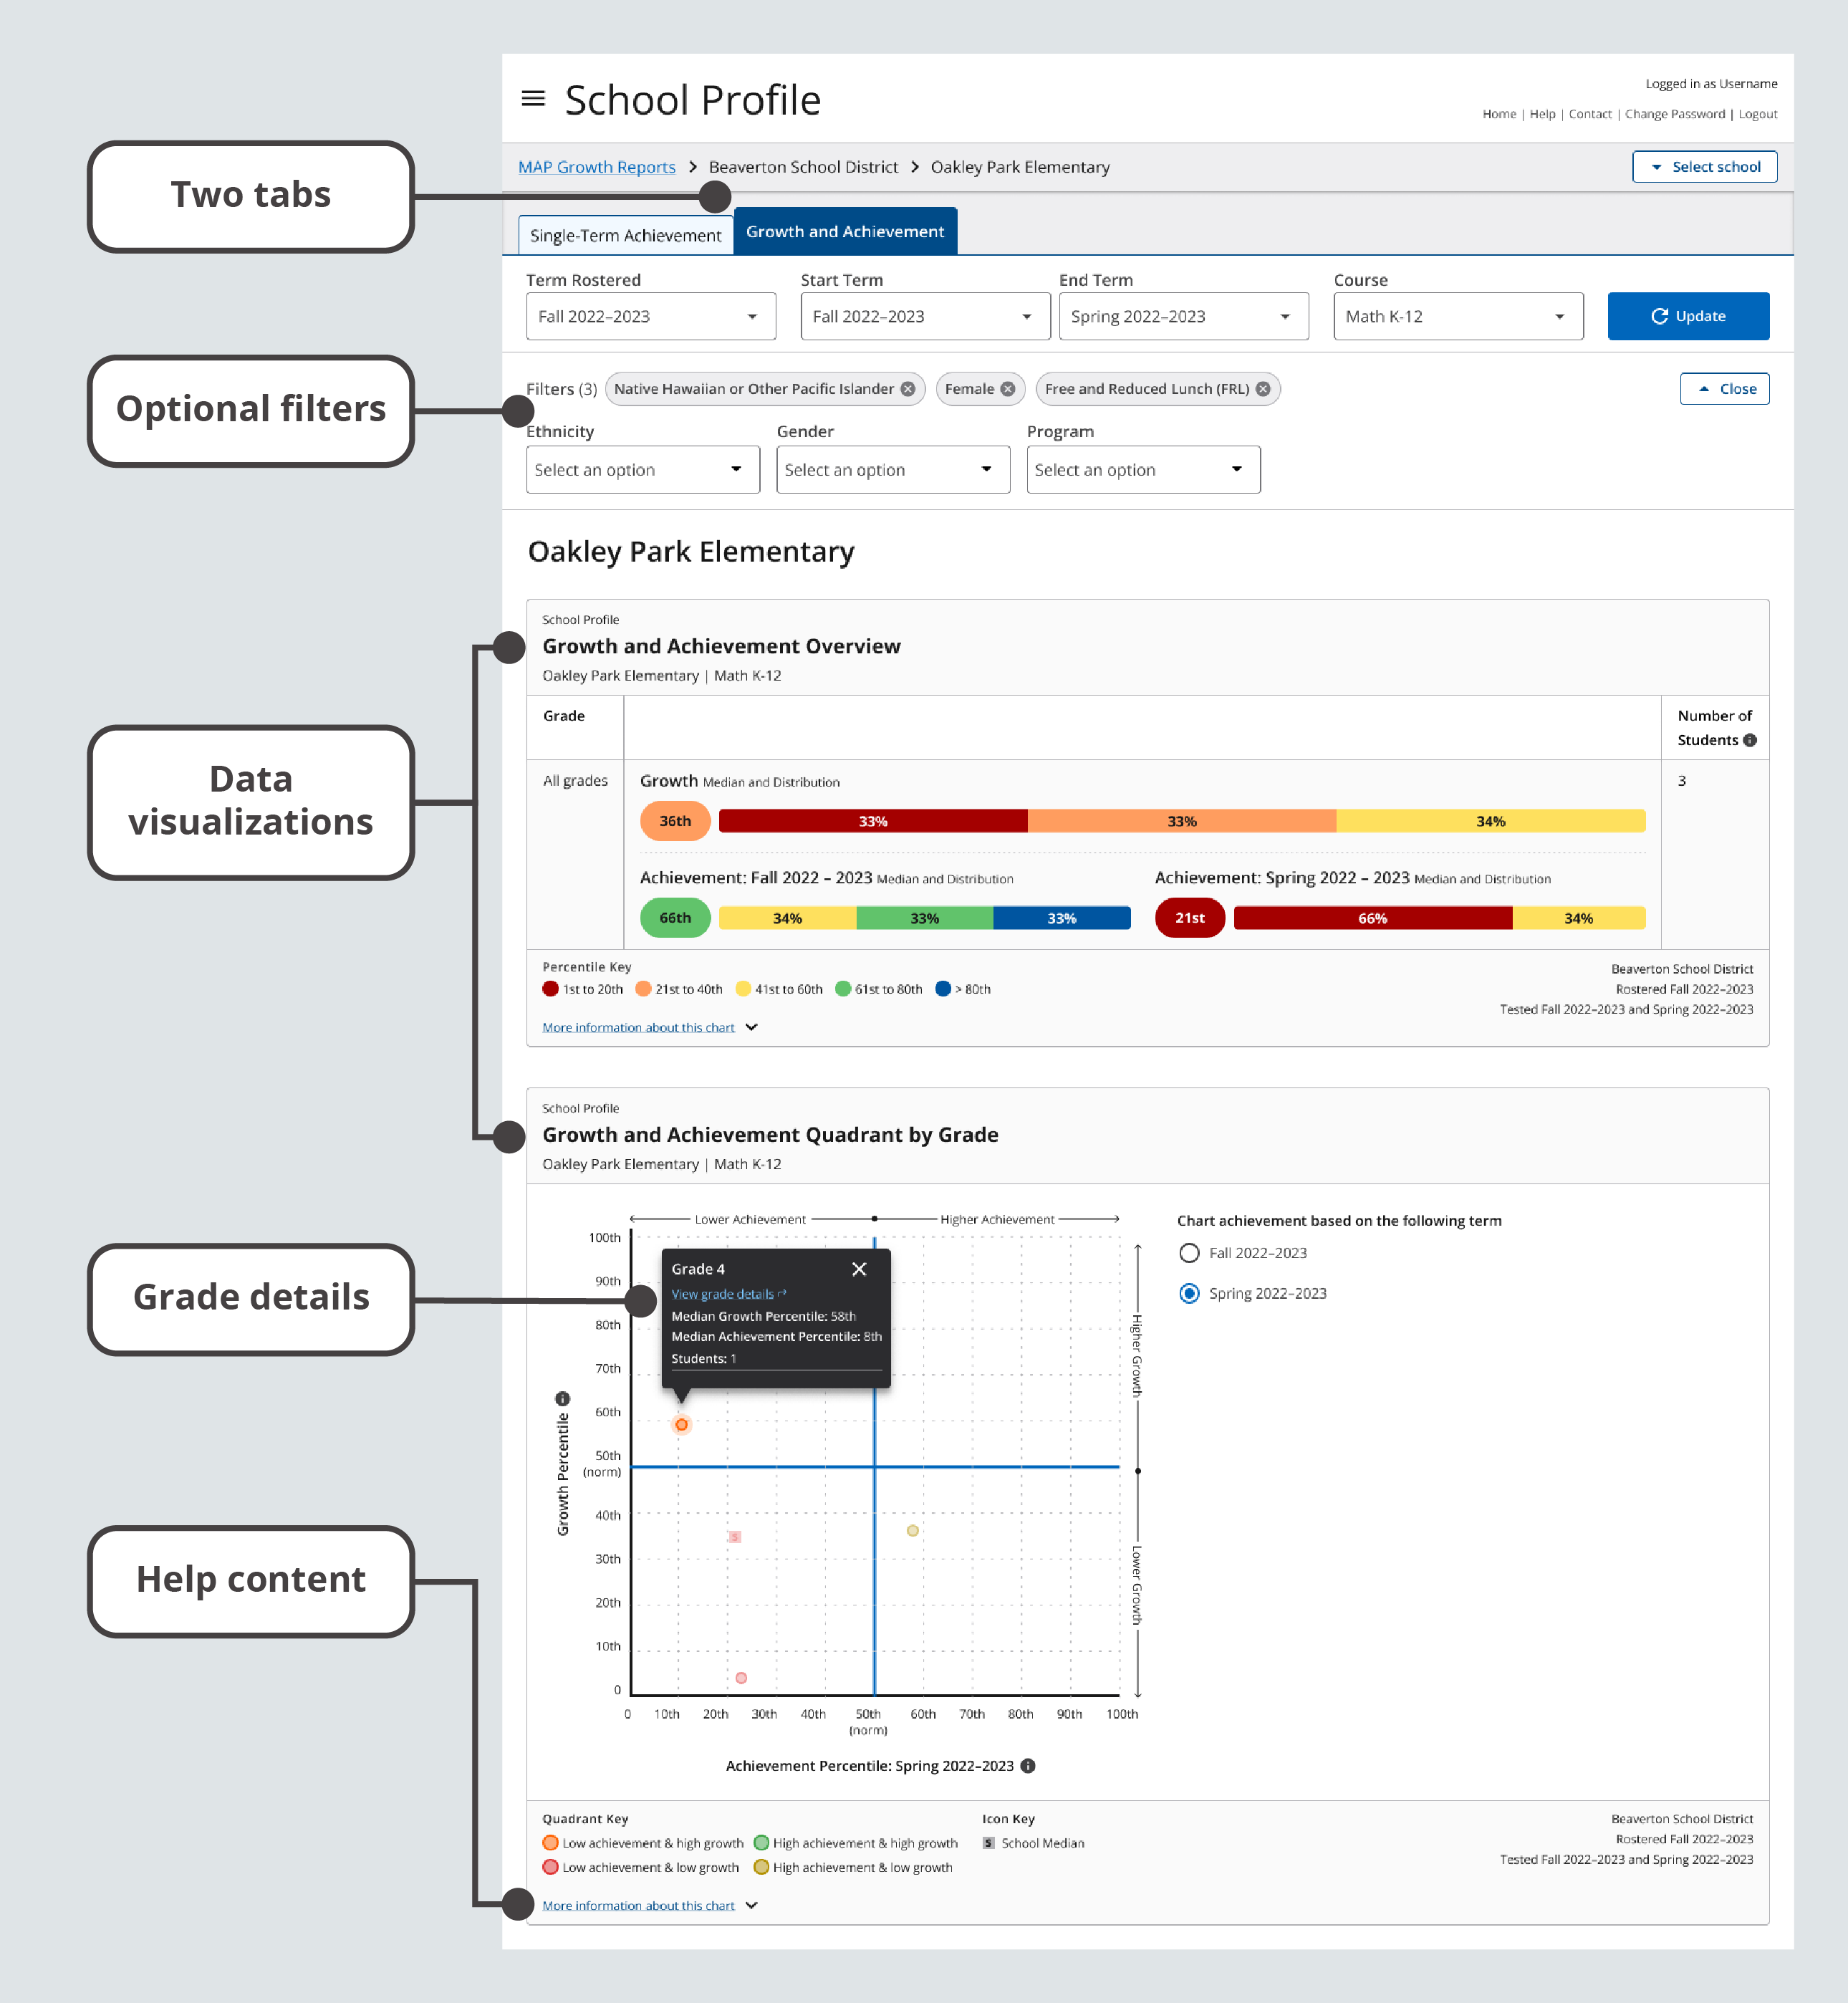
Key features of the School Profile report
Two tabs. Explore the Single-Term Achievement tab for performance in one term or the Growth and Achievement tab for achievement comparisons and growth between two terms.
Optional filters. Apply filters for ethnicity, gender, and/or program for data across grades, as well as class name and/or educator for data across classes.
Data visualizations. Gain insight into your school's performance with interactive charts and tables.
Grade details. Drill down to see data for each class in each grade.
Help content. Learn more about the data points in each chart.
Report requirements
The School Profile report provides data visualizations with the requirements described in the table below.
| Detail | Requirements |
|---|---|
| MAP Growth test types with reportable data | Any test event that’s considered a growth measure. Screening tests and tests taken outside the official test window are not considered growth measures. For more details about growth measures, explore Invalid Tests and Unofficial RIT Scores. |
| Date range for reportable data |
All fall, winter, and spring terms, beginning with academic year 2020–2021. Note: Term Rostered is only available for the current and previous academic year. |
| MAP Roles for report access | District Assessment Coordinator, School Assessment Coordinator, or Administrator. Learn more at Choose MAP Roles. |
Report access
To access the School Profile report:
-
Log in at start.mapnwea.org and choose MAP Growth from the main menu.
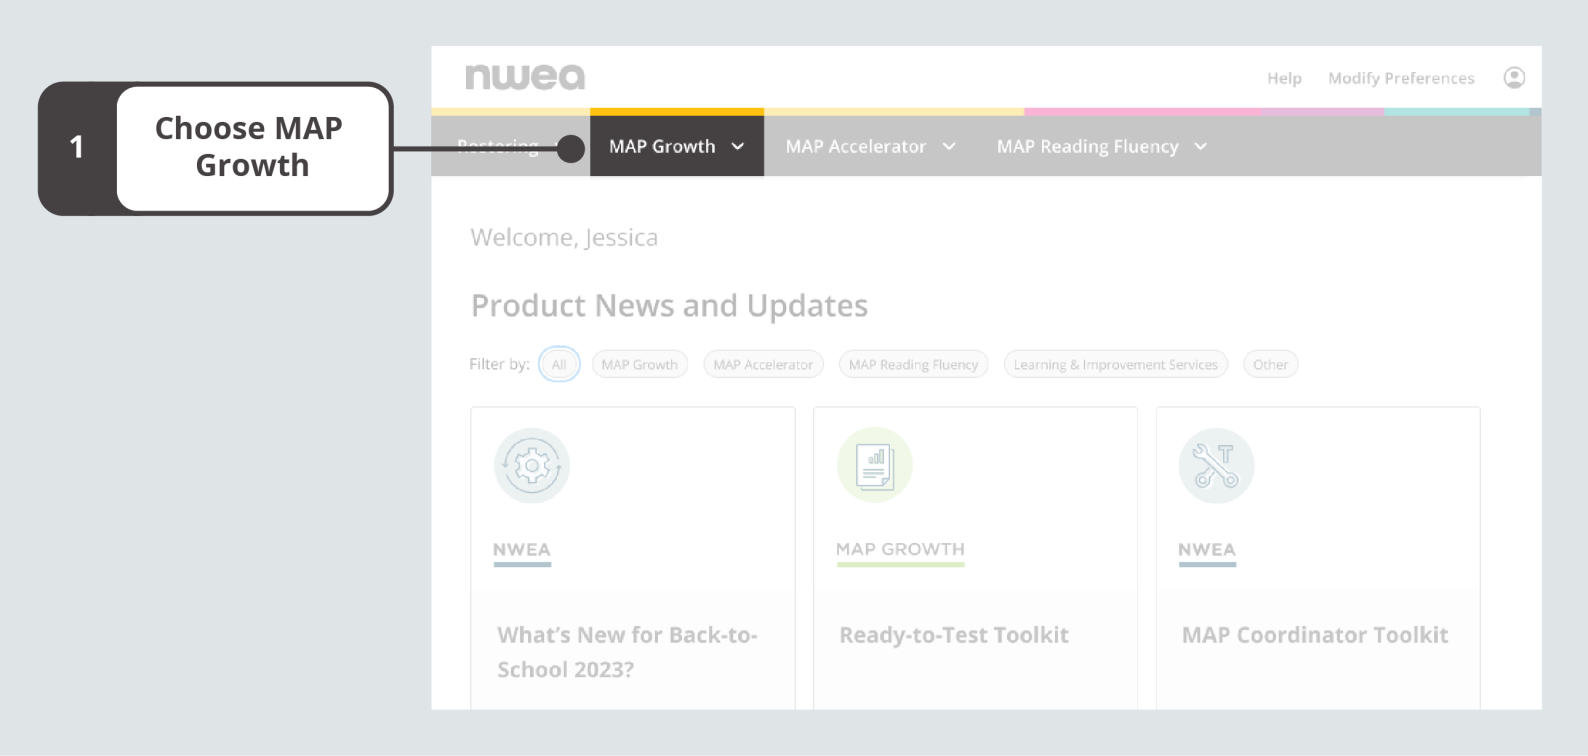
On the start page, choose MAP Growth.
-
Select School Profile.
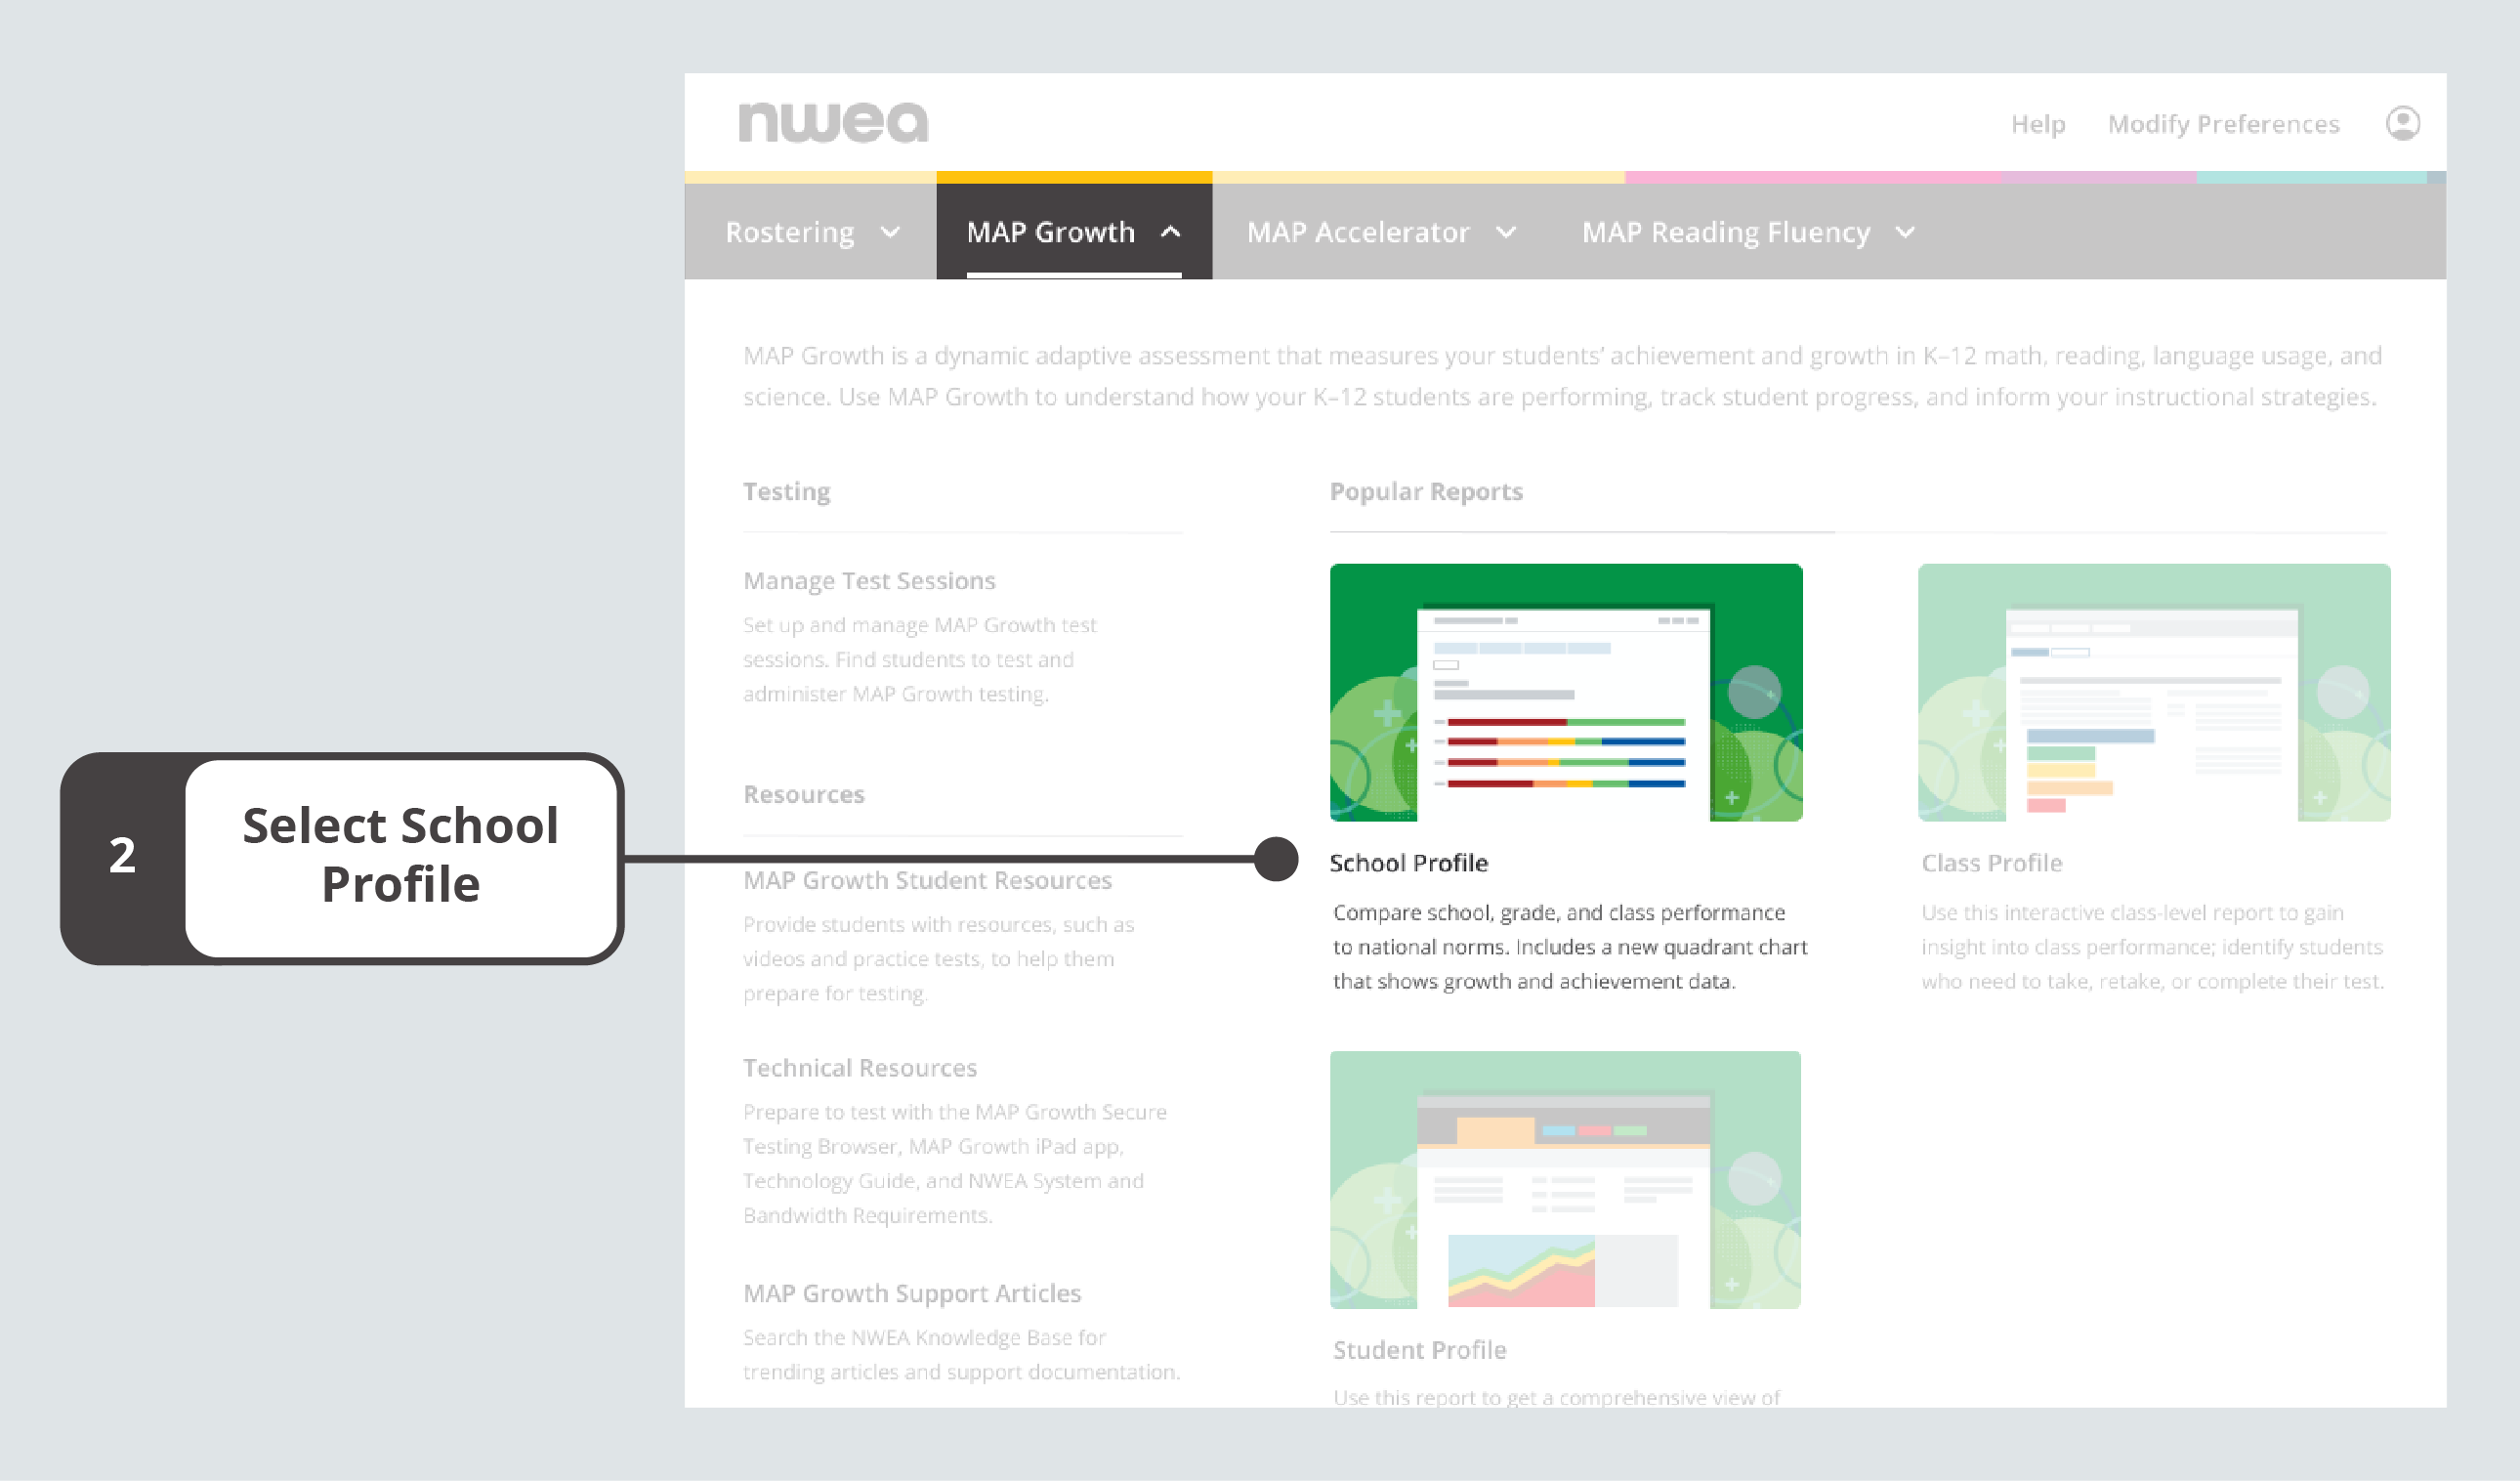
Select School Profile from the MAP Growth menu on the start page.
Exploring the Single-Term Achievement tab
Use the Single-Term Achievement tab to understand your school’s MAP Growth achievement in one term.
Accessing single-term achievement data for grades
To get single-term achievement data for all grades in a school:
-
Go to the Select School button. This will expand a section that identifies your district and school. If applicable, choose the school you want to view; then select Update.
-
Make sure you're on the Single-Term Achievement tab.
-
Confirm or adjust the default values for each required field (Term Rostered, Term Tested, and Course).
-
Select Update and review the results. You can sort the data by any of the column headers.
Note: Each time you change any of the required fields, it’s important to select Update to refresh your data.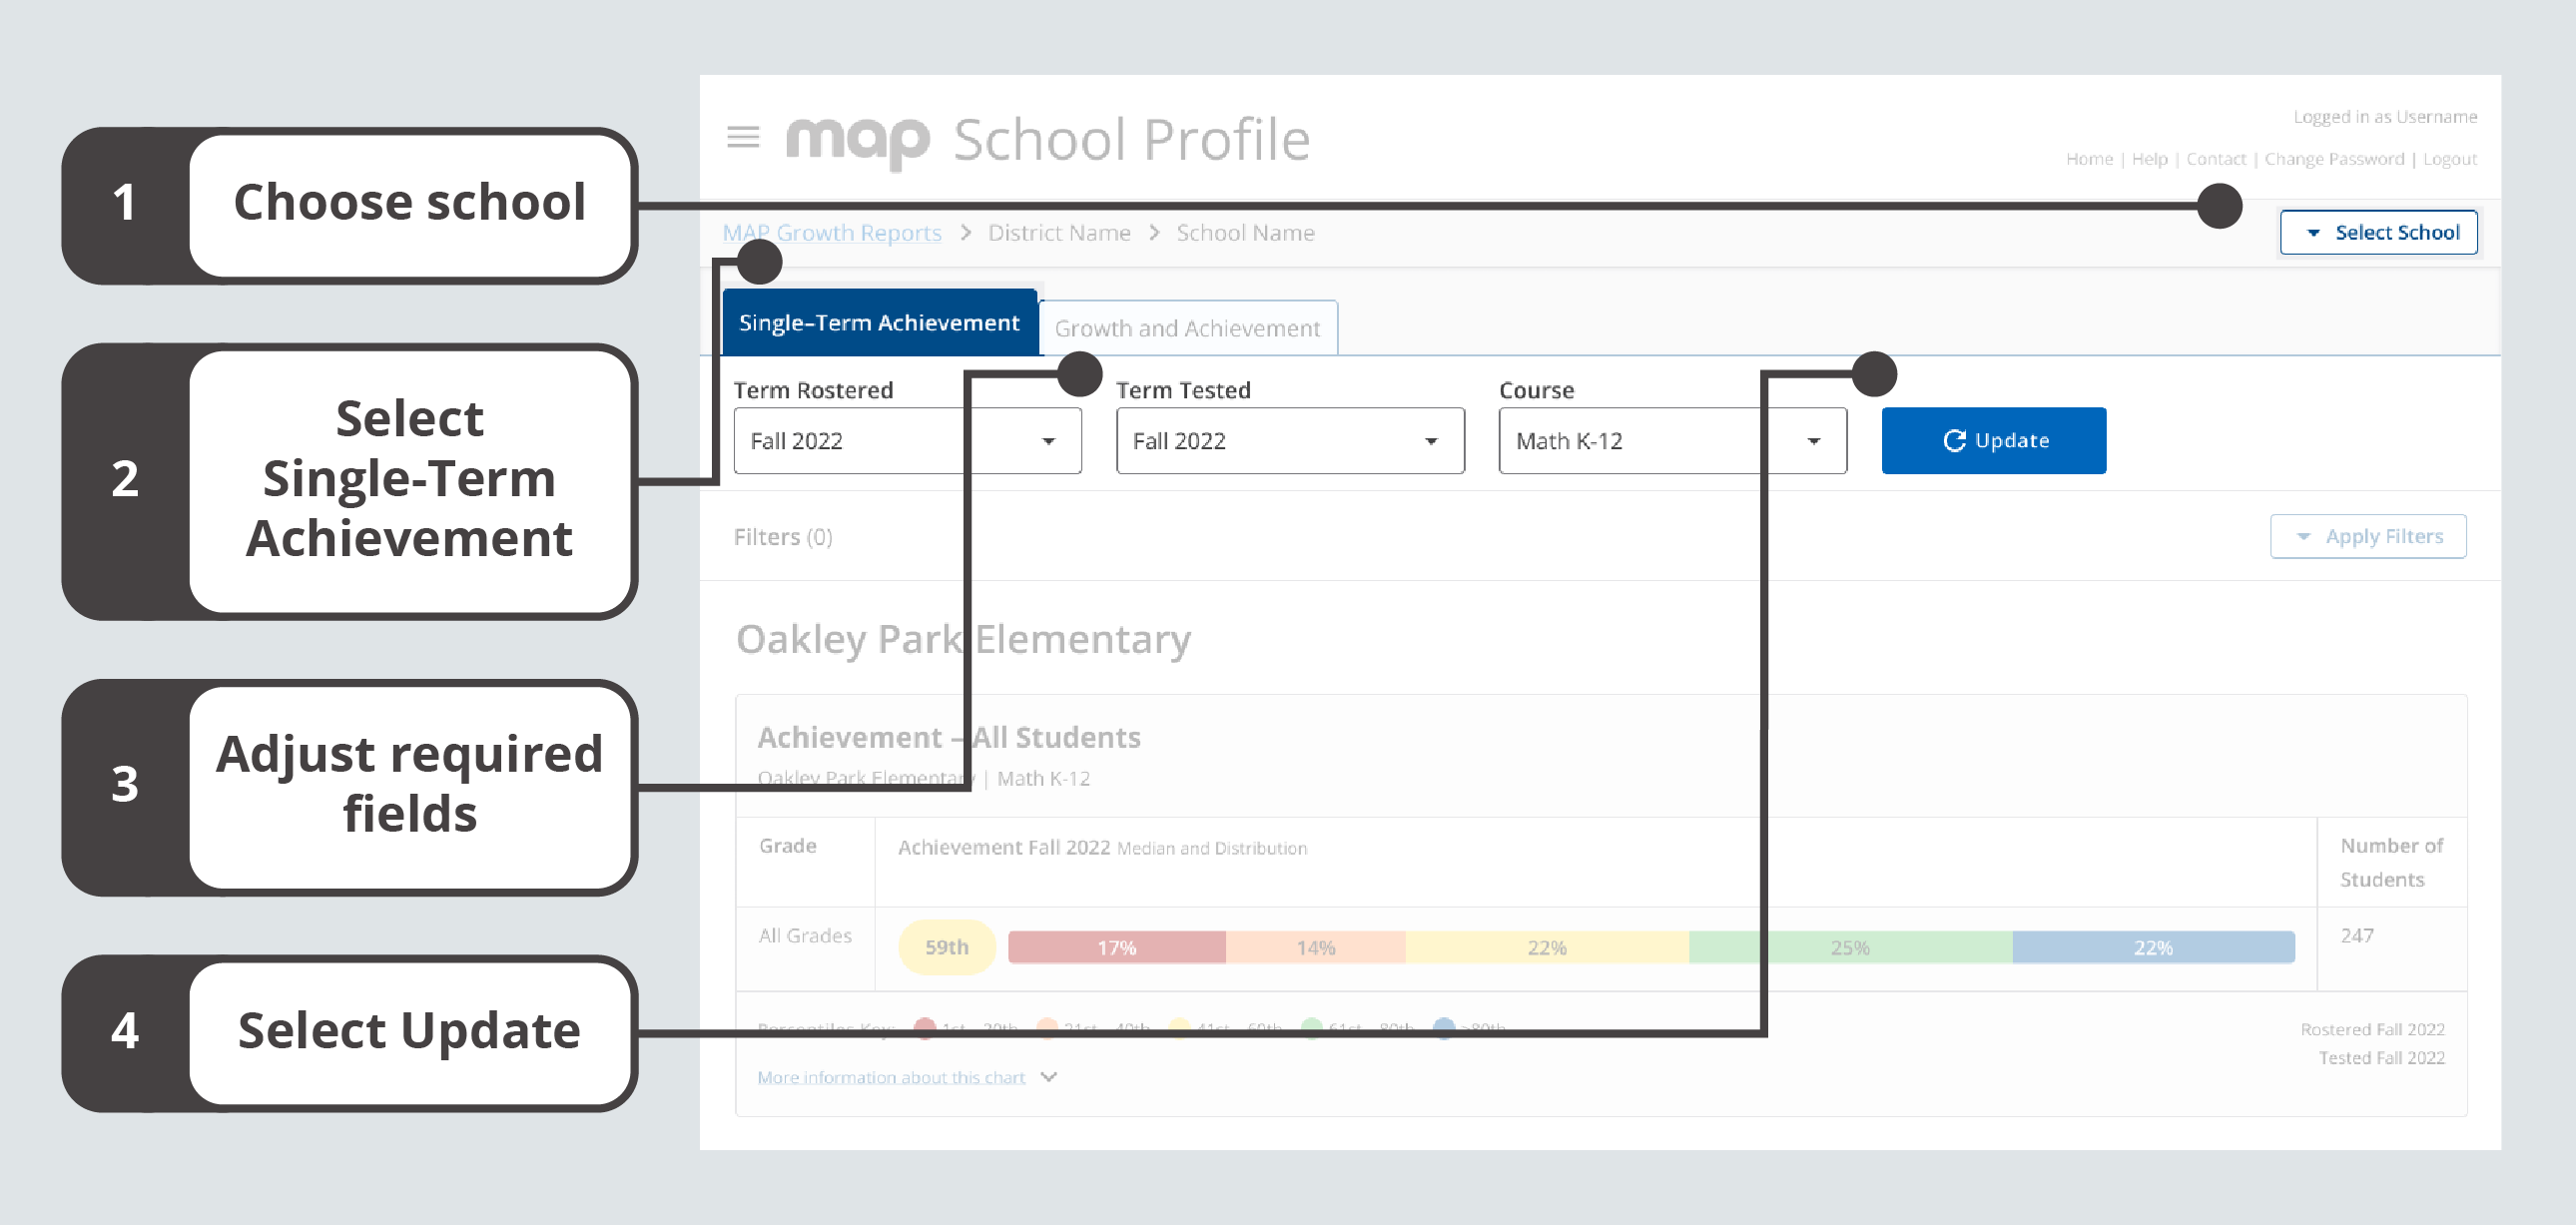
Steps for getting achievement data for a single term
Adjusting required fields on the Single-Term Achievement tab
When you access the School Profile report, the required fields will be populated with default values. You may want to adjust the values to better meet your needs. Table 2 explains the required fields.
| Required Field | Explanation |
|---|---|
| Term Rostered |
The term that reflects the rostering relationships (for example, students in classes, classes in grades, etc.) that you’re interested in viewing. Note: You can only select a term from the current or previous academic year. |
| Term Tested |
The term with the test events you want to see. For example, in the fall you might want to see results from the previous spring. Note: You can select the current term or any previous term beginning with the 2020–2021 academic year. |
| Course | A specific test and/or a grouping of tests licensed to a school, district, or state. |
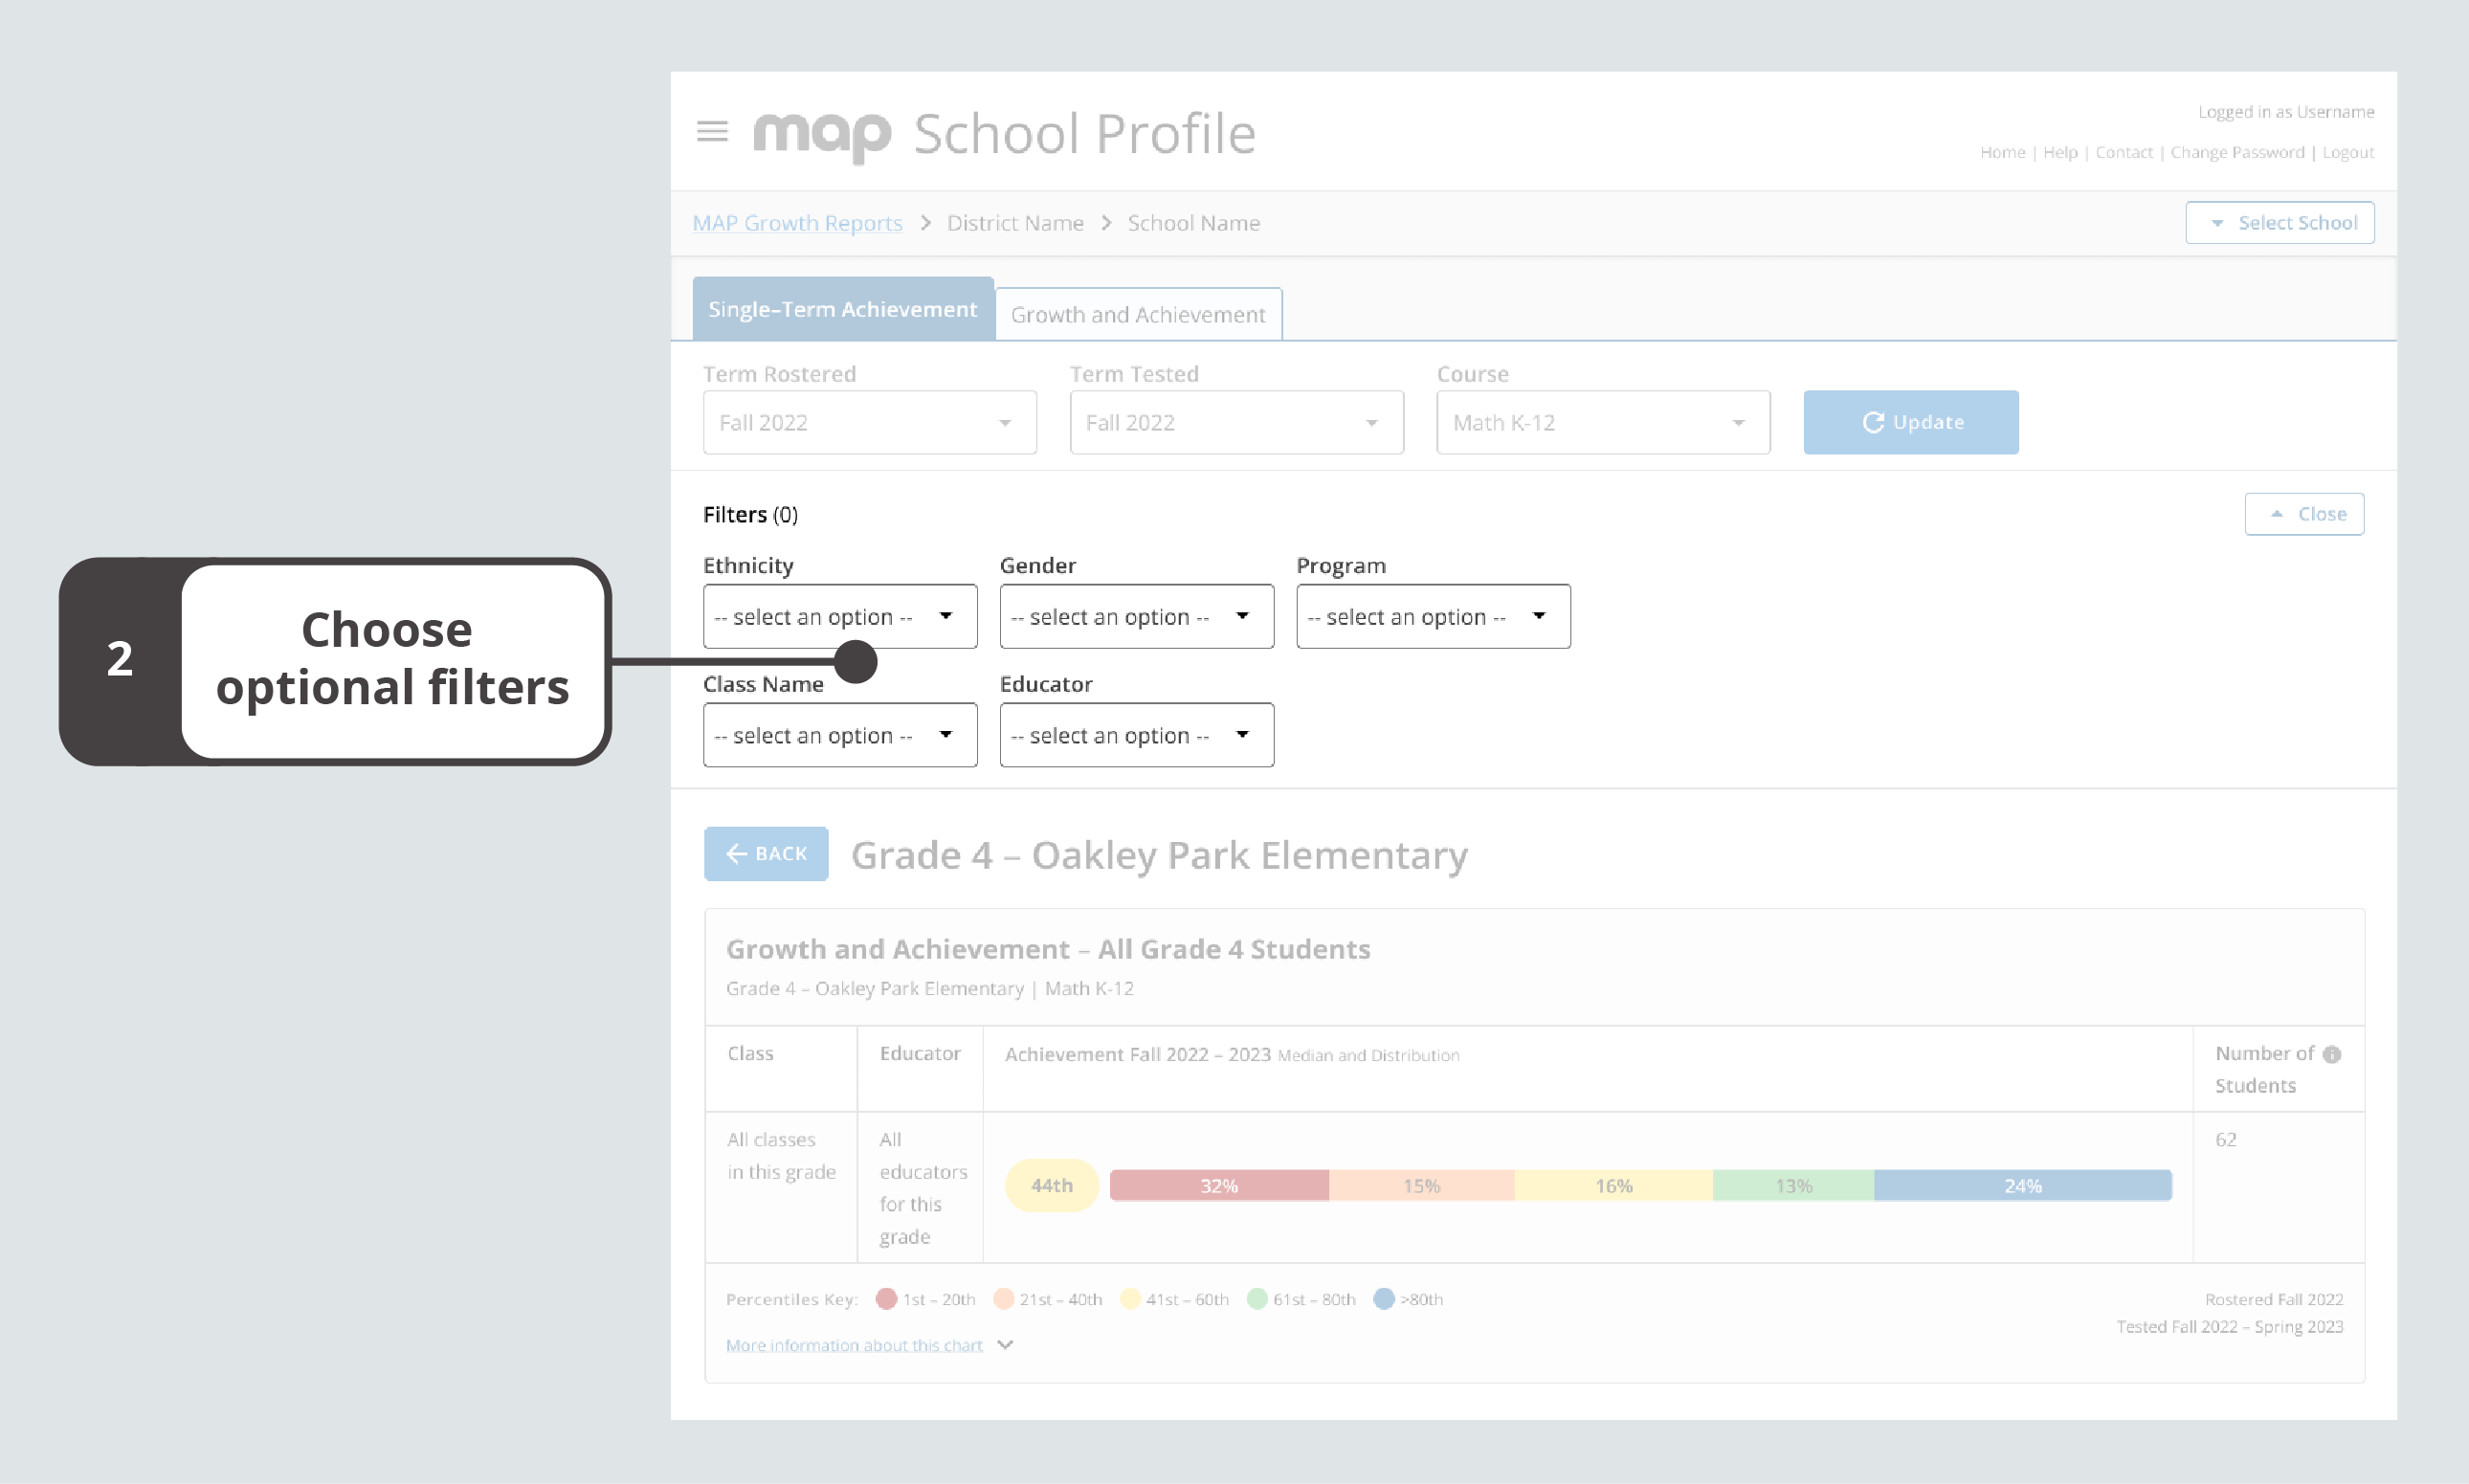
Adding optional filters
To add optional filters for Ethnicity, Gender, and/or Program:
-
Select Apply Filters to expand the Filters section.
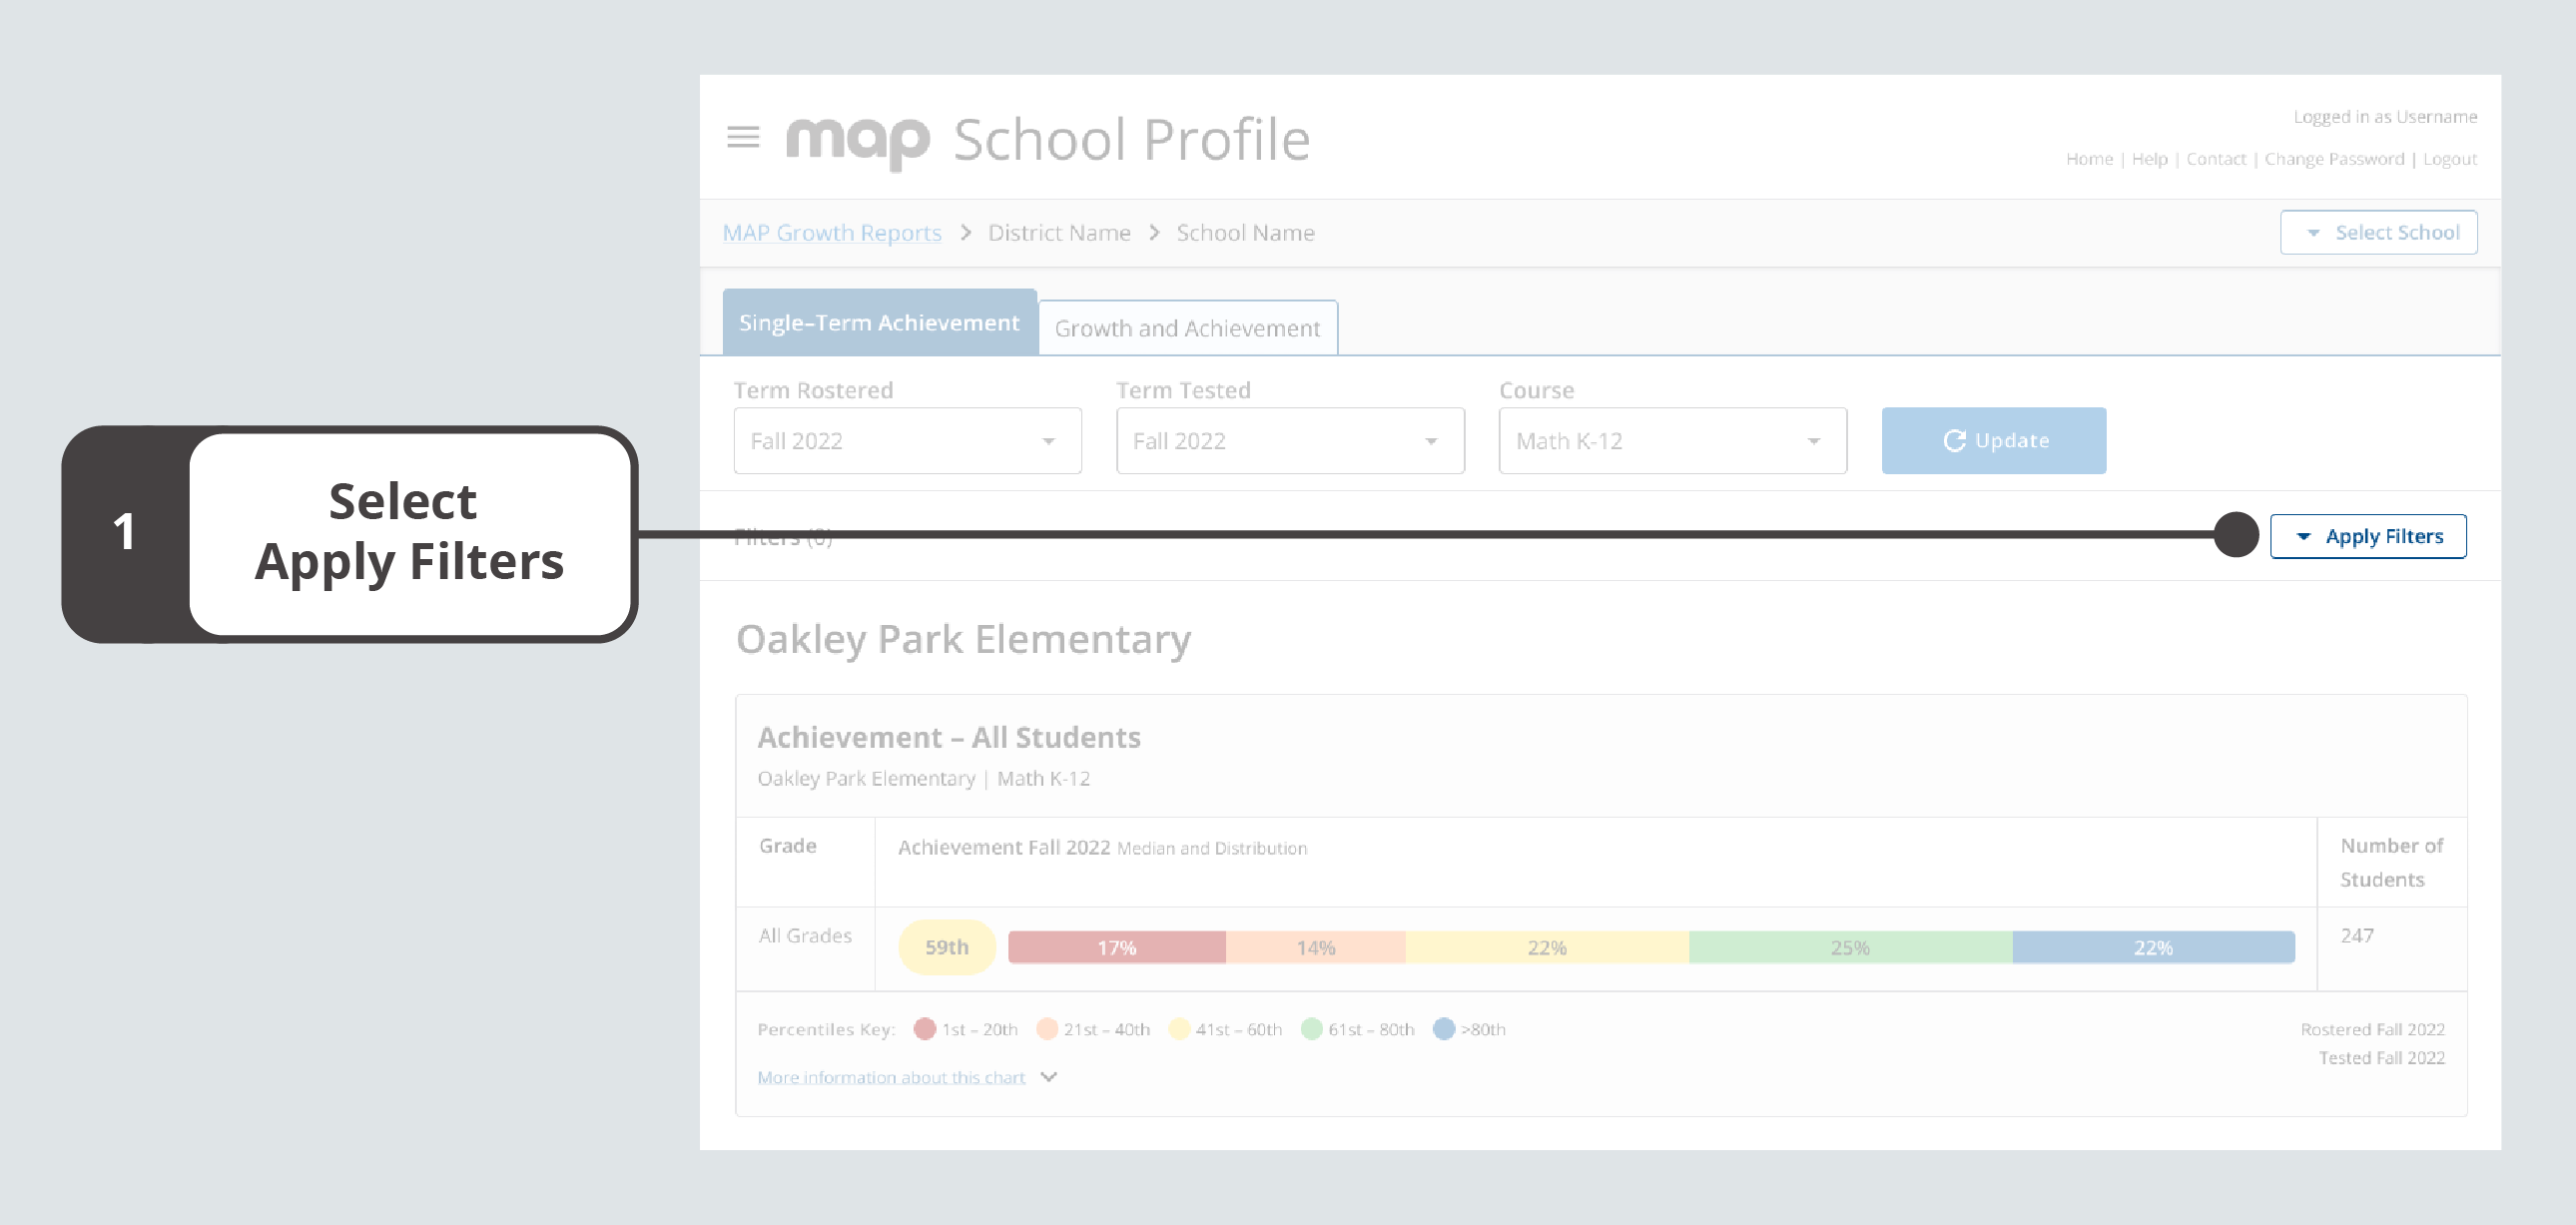
Single-Term Achievement tab with Apply Filters highlighted
-
From the drop-down menus that appear, select options for Ethnicity, Gender, and/or Program filters.
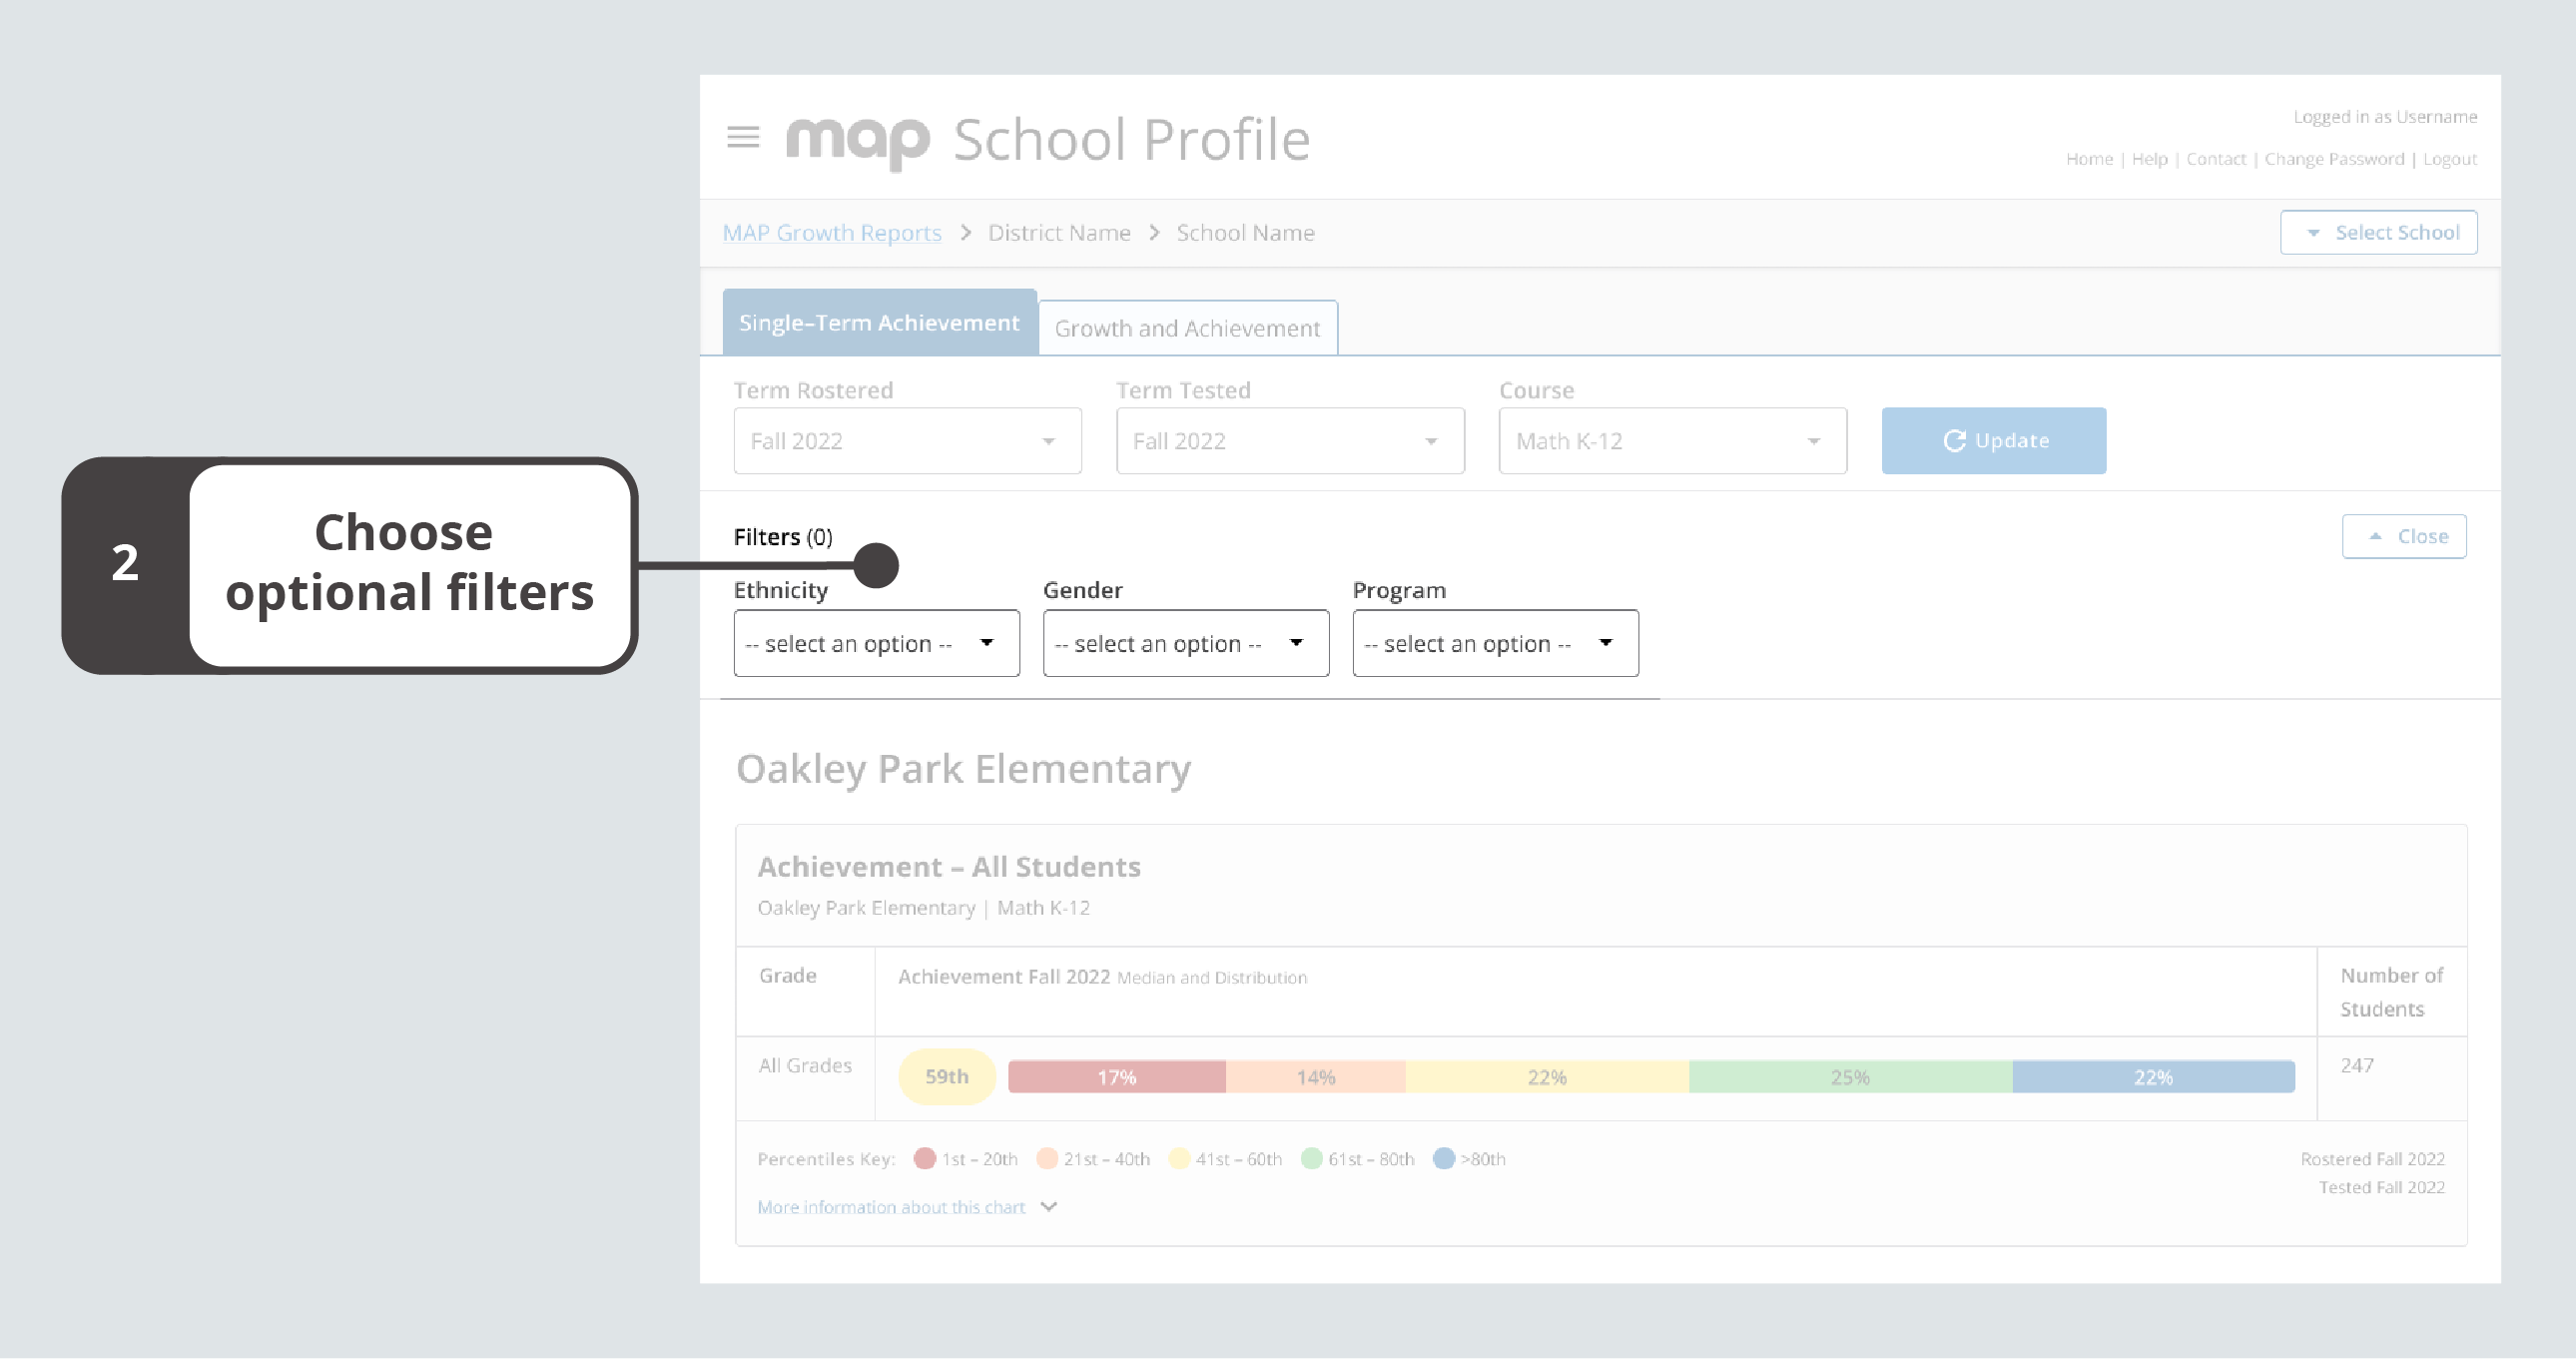
Optional Ethnicity, Gender, and/or Program filters
Note: You will only find filter options that apply to your selected data from the required fields. Additionally, no results will display if no data matches your filter selections.
Clearing optional filters
To clear filters:
-
Remove a filter by selecting the X associated with that filter selection. Remove all filters by selecting Clear All.
-
Select Close to collapse the filter section.
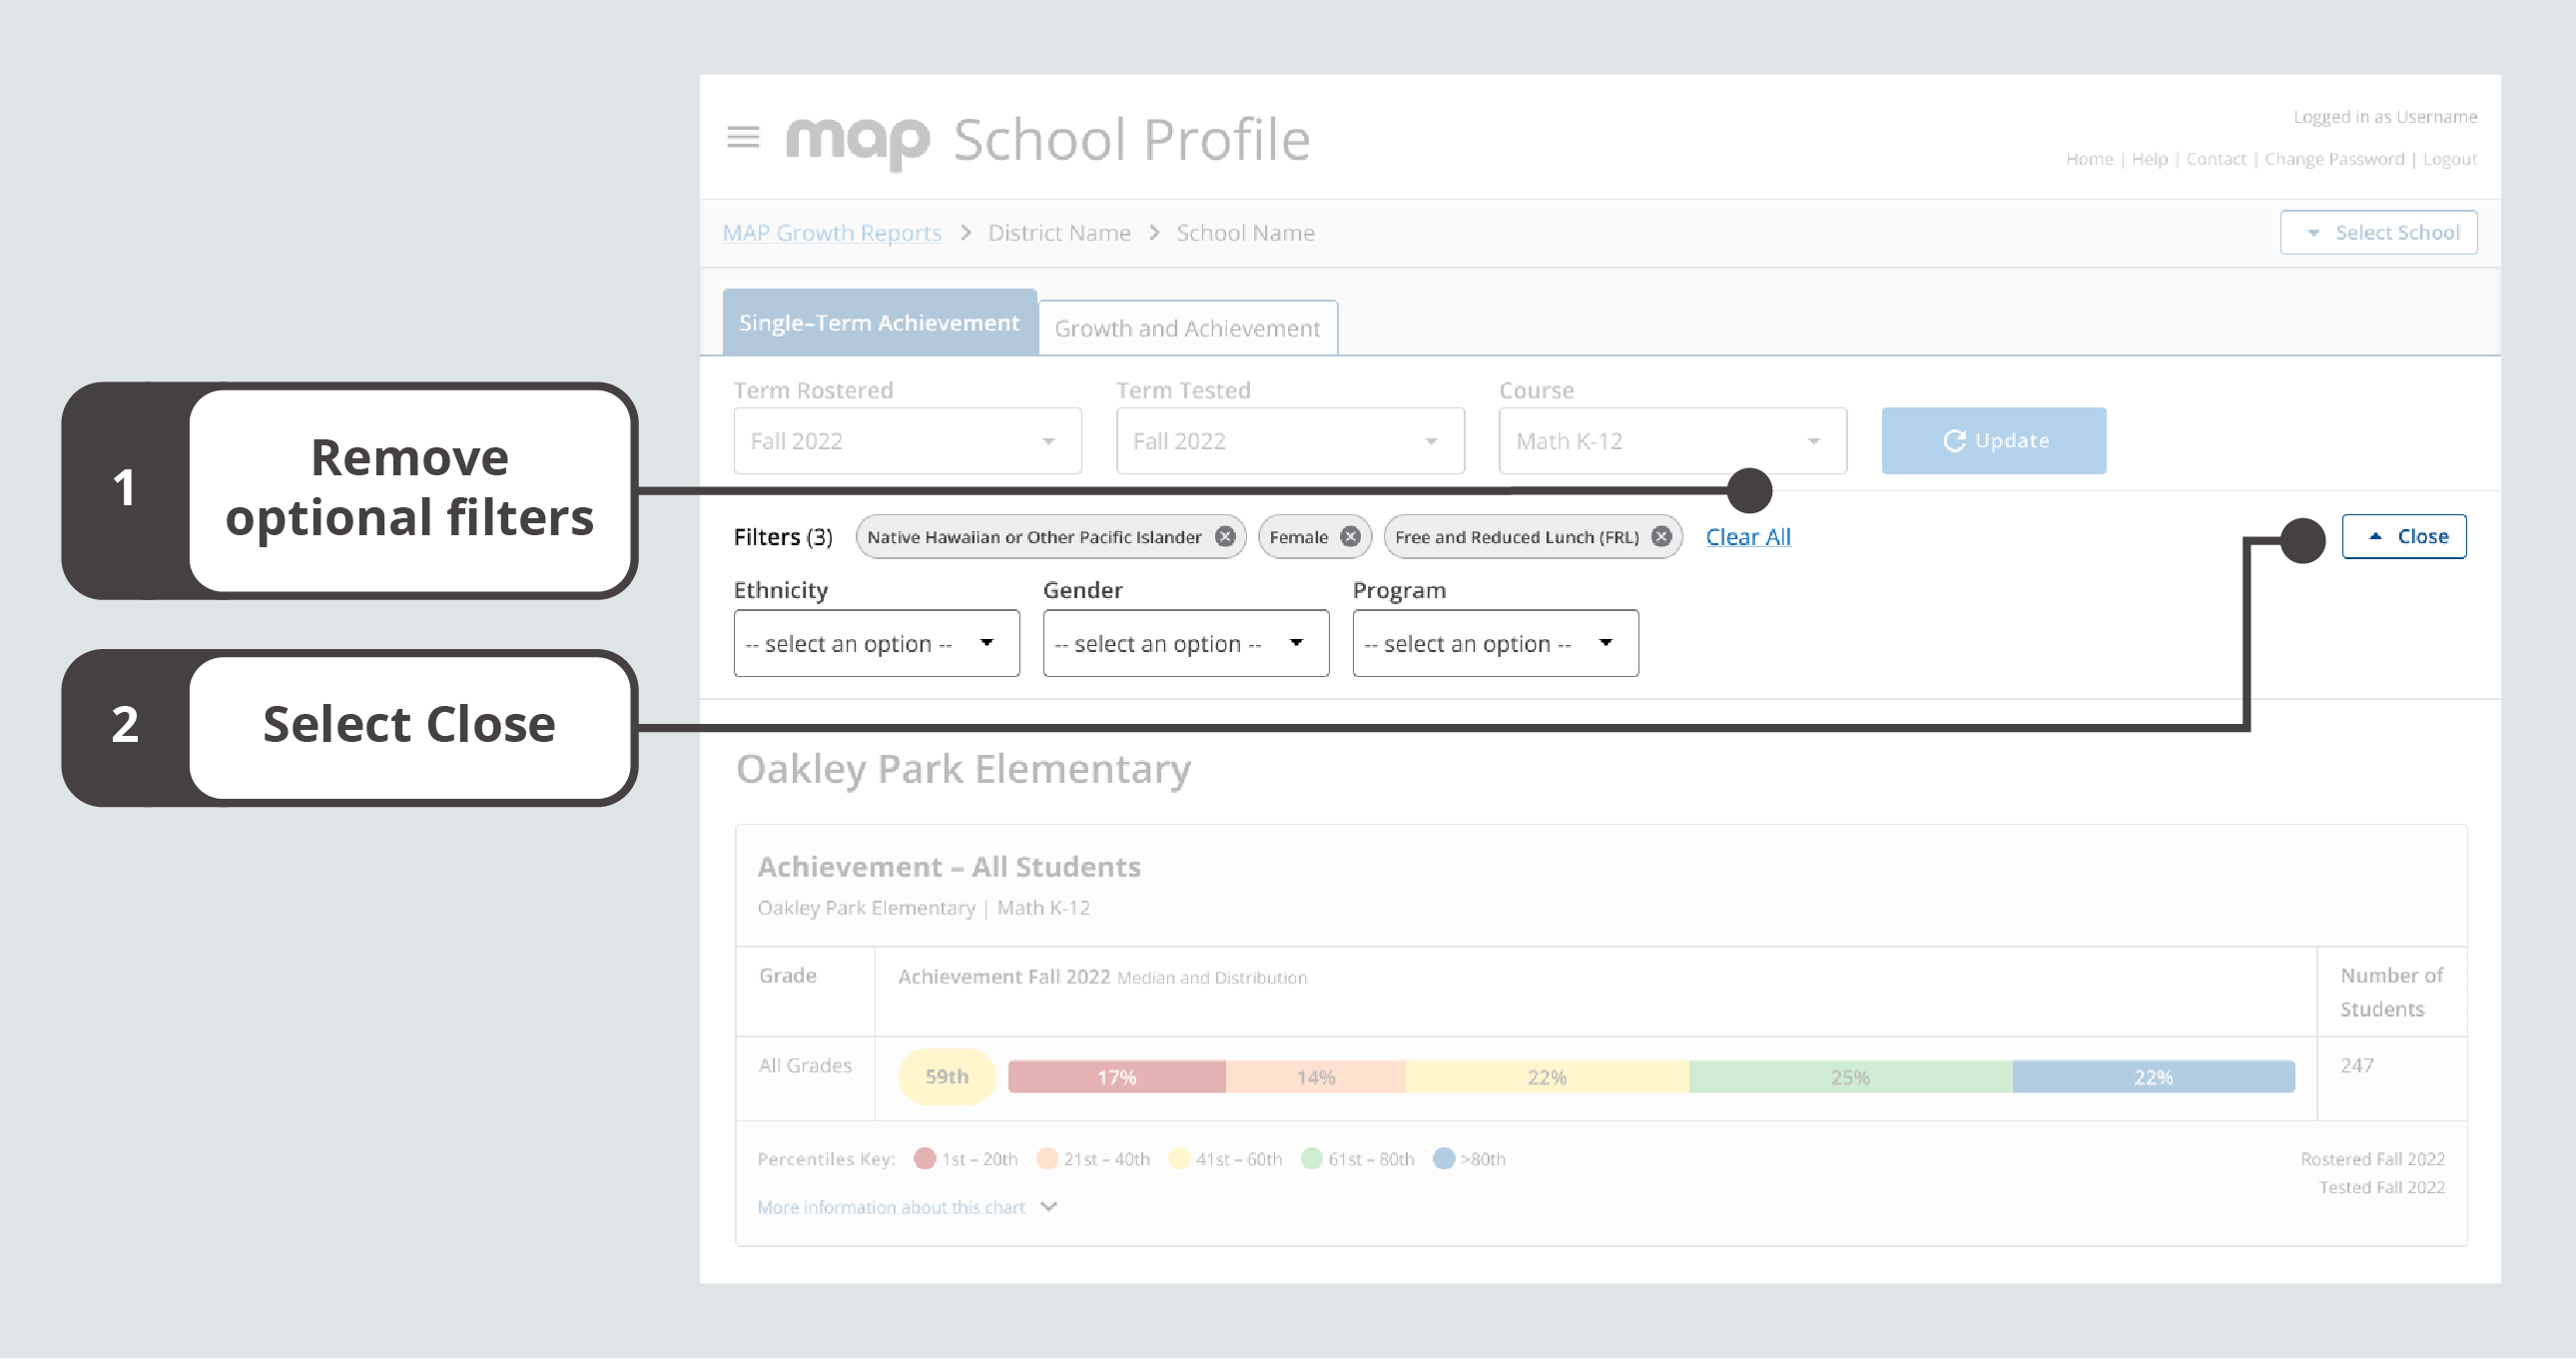
Single-Term Achievement tab with Clear All and Close highlighted
Understanding single-term achievement medians and distributions
For each grade in a school, you can review the median achievement percentile and a breakdown of achievement percentiles by quintile. You can also find the number of students who have a valid growth measure in a particular population.
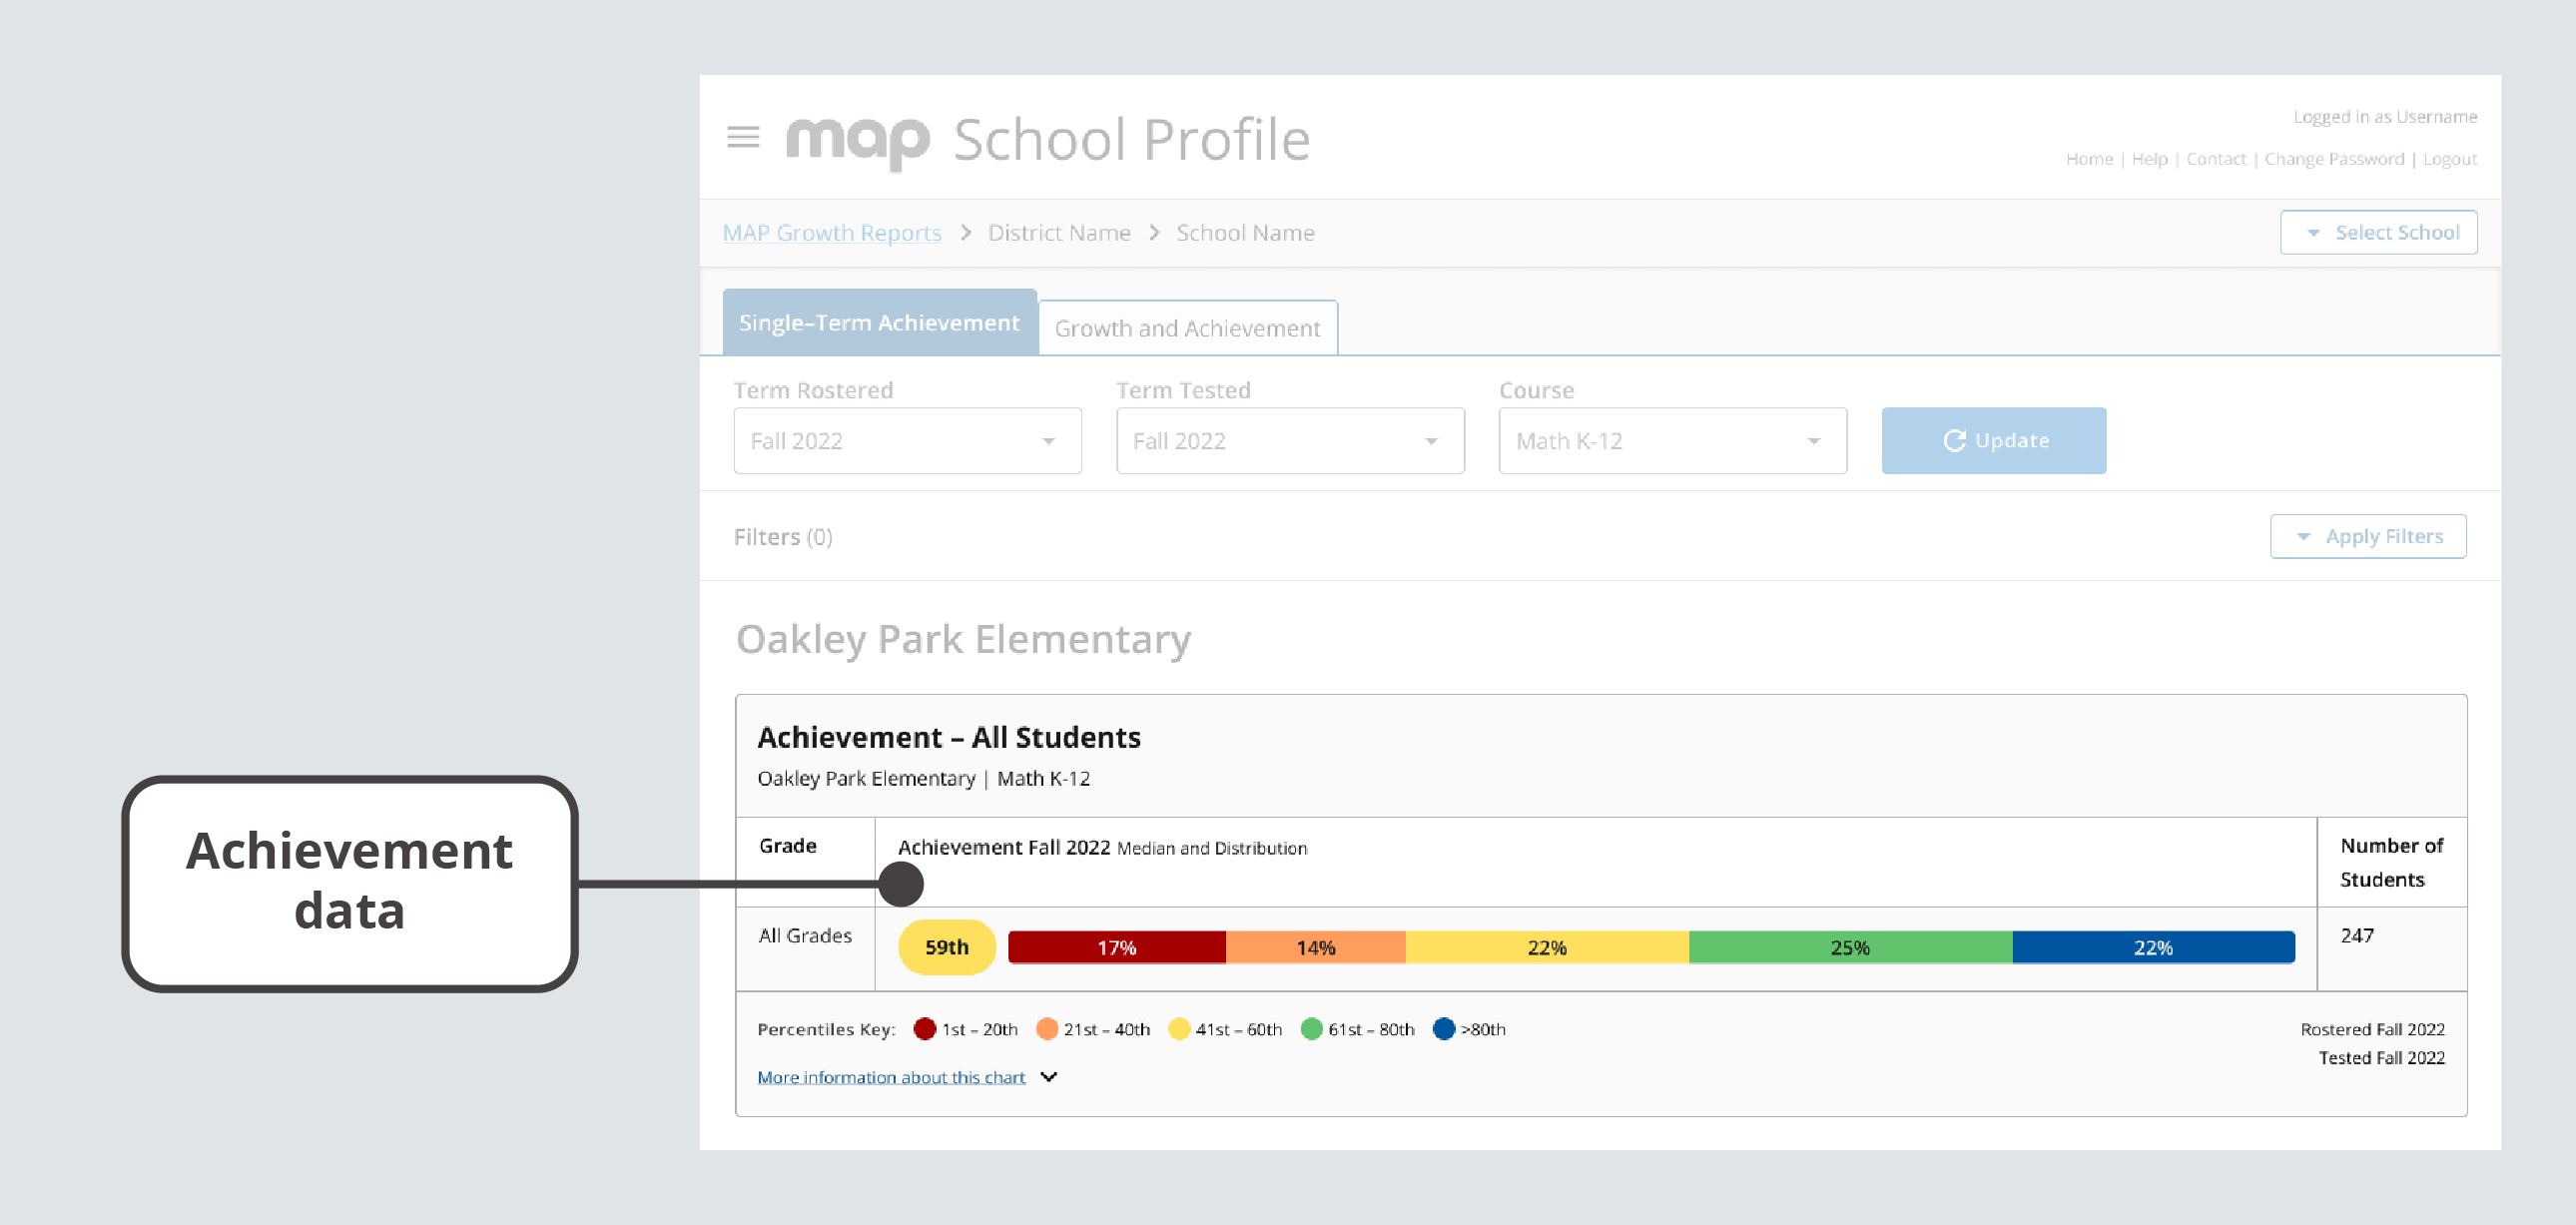
Median and distribution data on the Single-Term Achievement tab
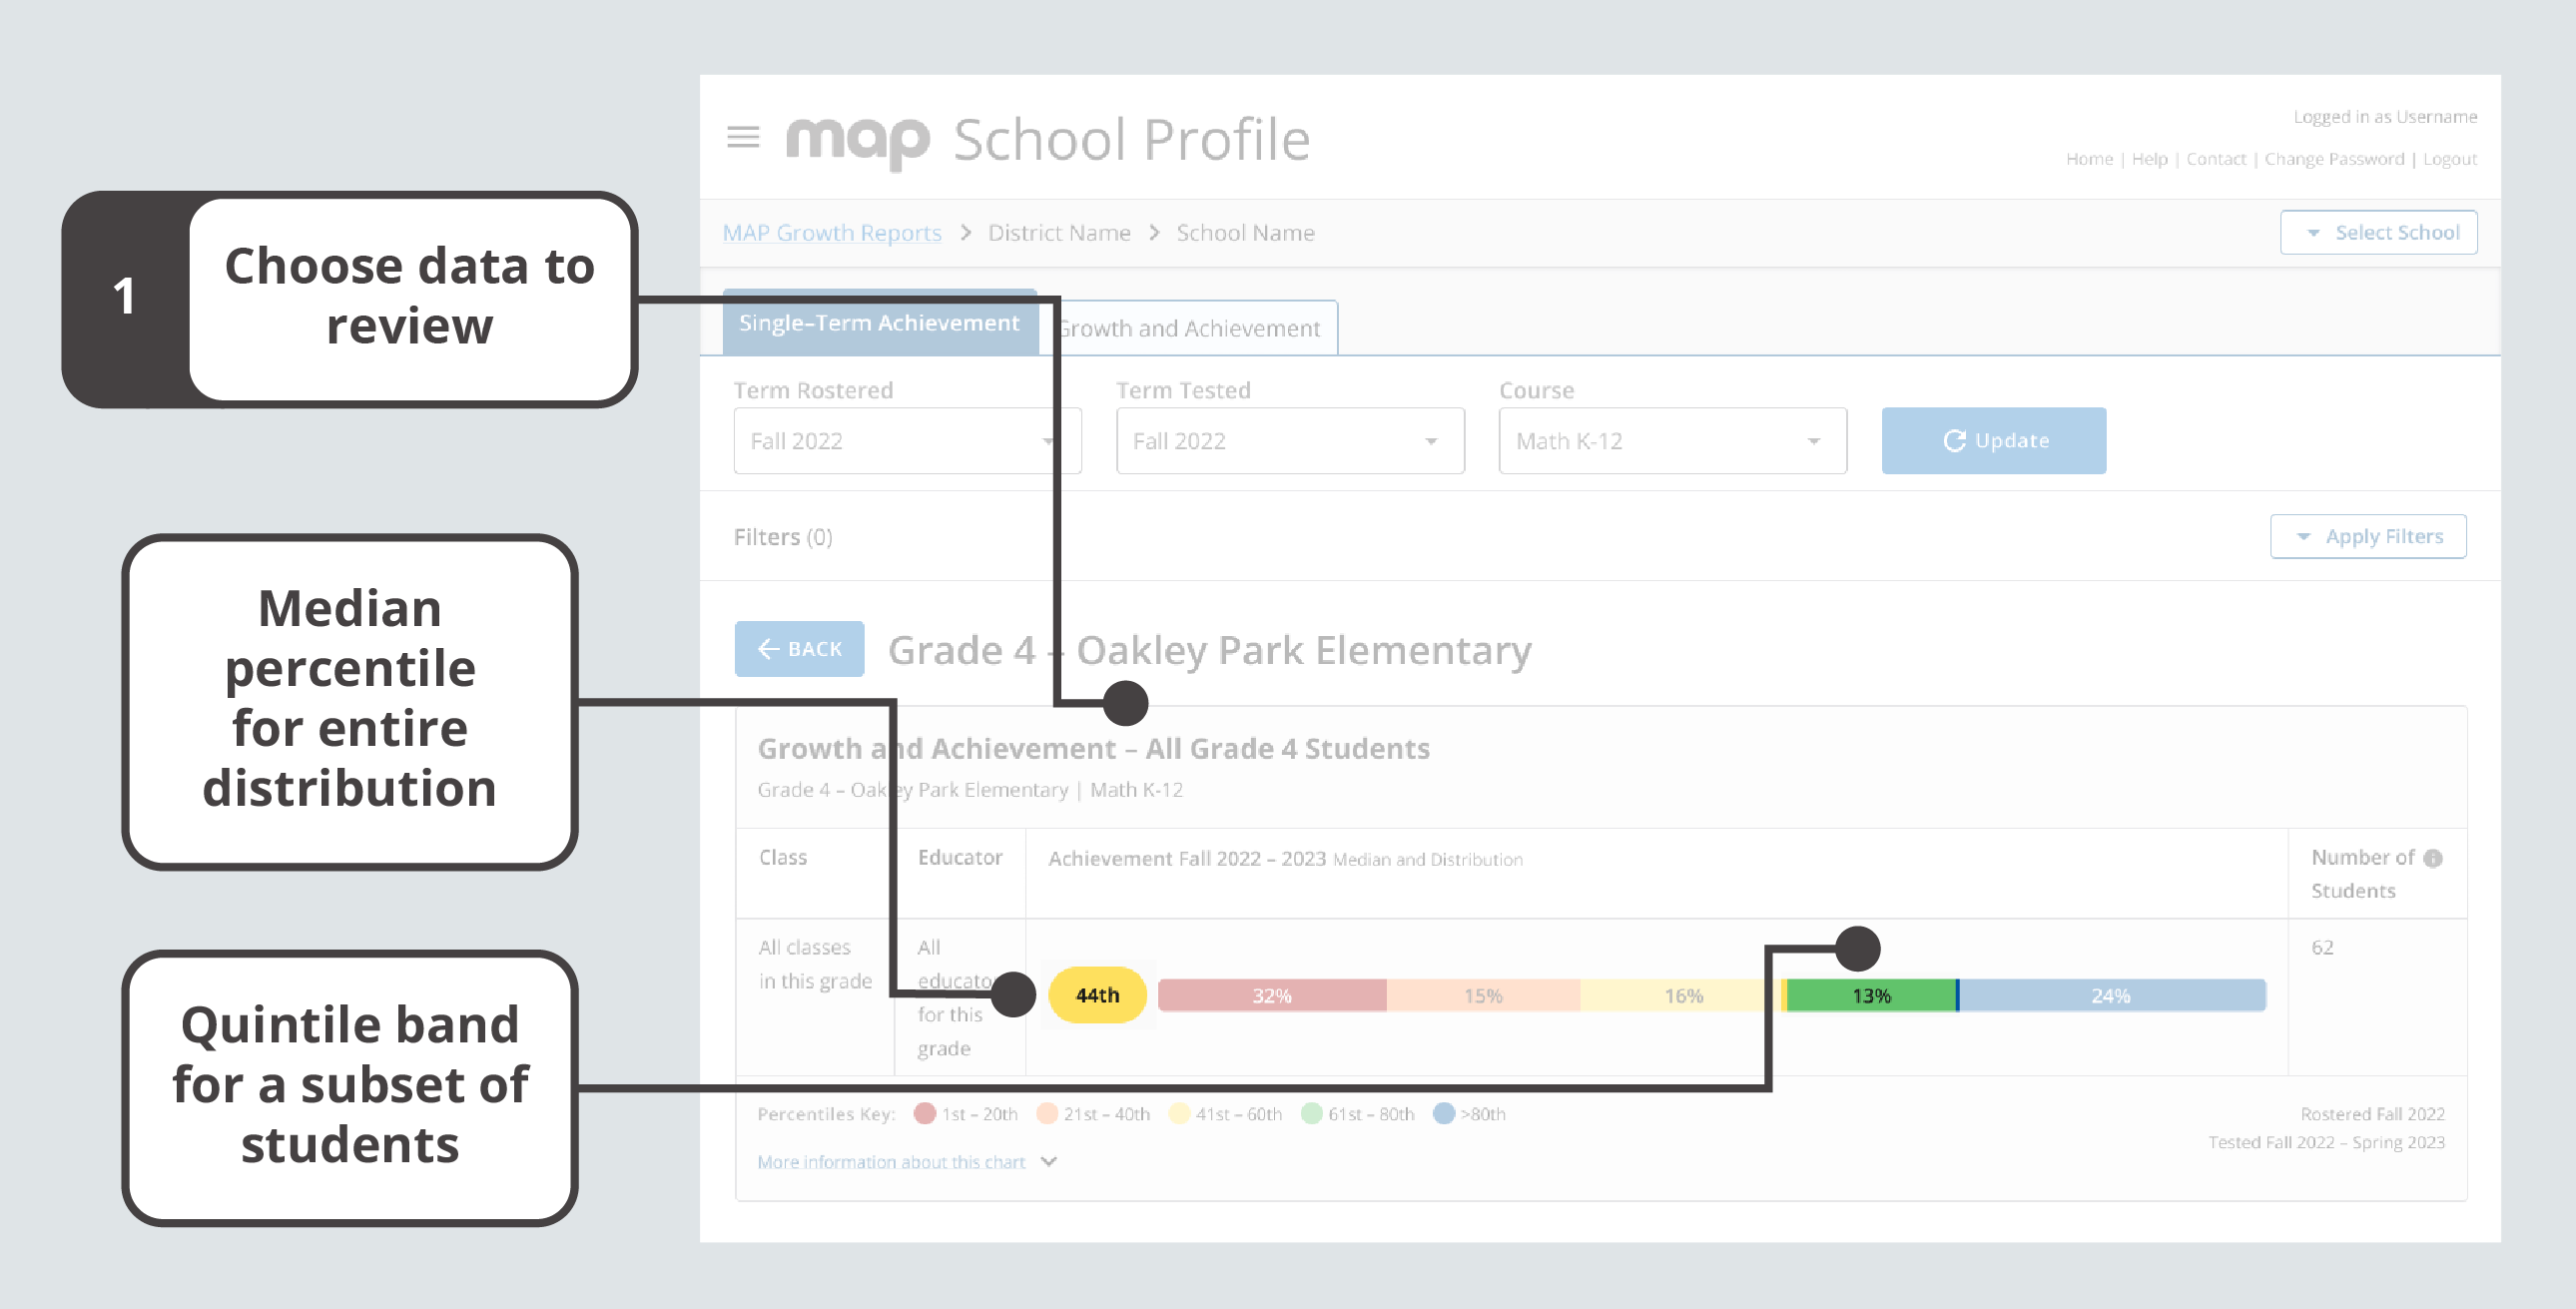
For a visual explanation of how the data is arranged, consider the diagram below.
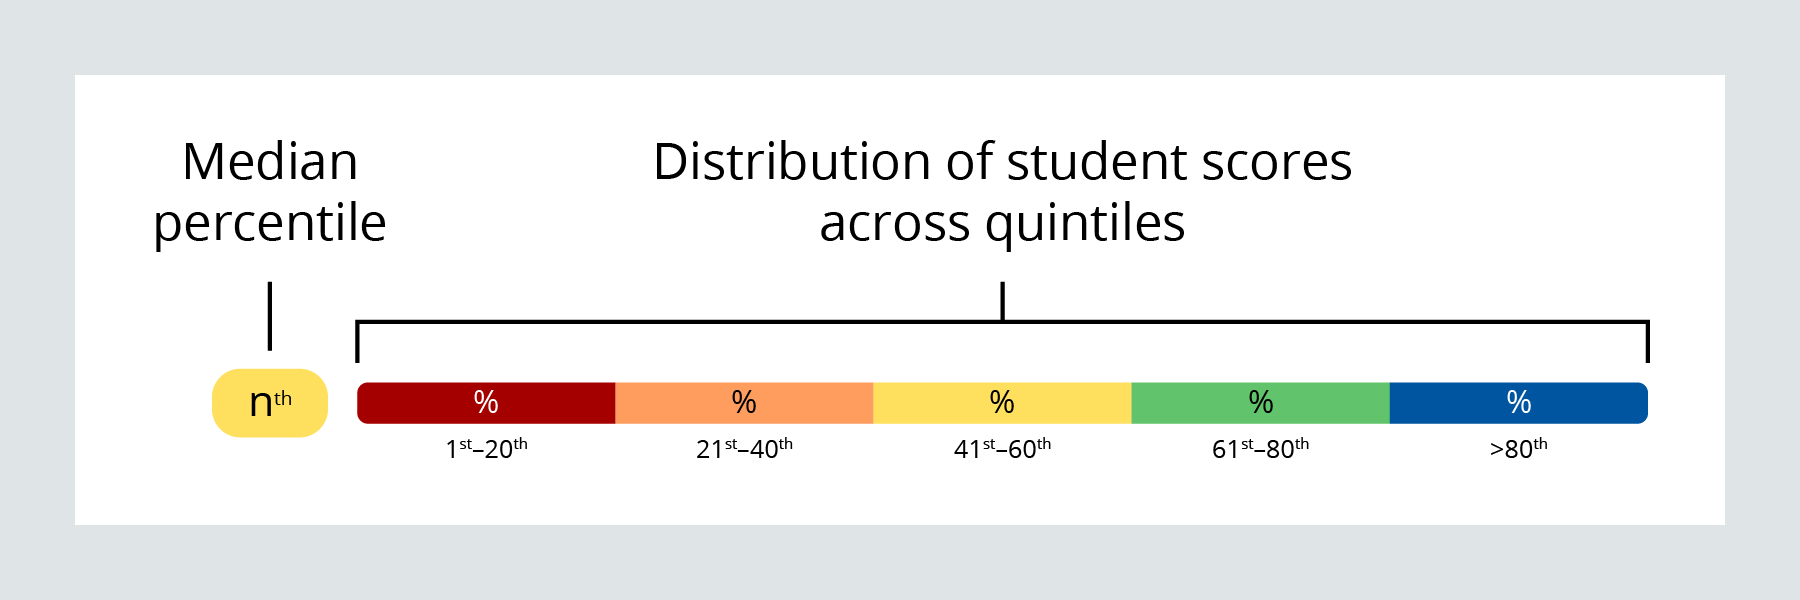
Visualization with median percentile and distribution labeled
| Data Point | Explanation |
|---|---|
| Achievement (also called Single-Term Achievement) | Student performance at a single moment in time. You can use achievement percentiles to understand how student scores compare to other same-grade US student scores. |
| Percentile | Norm-based information about where a student’s observed score falls within the range of scores produced by other same-grade US students. |
| Median Percentile | The middle percentile when a group of percentiles are ordered from lowest to highest. |
| Distribution | A representation of the range of scores for a group of students, indicating the number and/or percentages of scores within five percentile levels, or quintiles. |
| Quintiles | Five percentile levels based on NWEA normative data: 1st–20th (red), 21st–40th (orange), 41st–60th (yellow), 61st–80th (green), and greater than 80th (blue). |
| Number of Students | The number of students rostered in the selected Term Rostered field who also have a valid growth measure in the selected Term Tested field. For more details about growth measures, explore Invalid Tests and Unofficial RIT Scores. |
Exploring the Growth and Achievement tab
The second tab on the School Profile report is the Growth and Achievement tab. On this tab you can explore data across two terms through medians and distributions, as well as through the Growth and Achievement Quadrant.
Accessing growth and achievement data for grades
To get growth and achievement data for all grades in a school:
-
Go to the Select School button. This will expand a section that identifies your District and School. If applicable, choose the school you want to view; then select Update.
-
Make sure you are on the Growth and Achievement tab.
-
Confirm or adjust the default values for each required field (Term Rostered, Start Term, End Term, and Course).
-
Select Update and review the results. You can sort the data by any of the column headers.
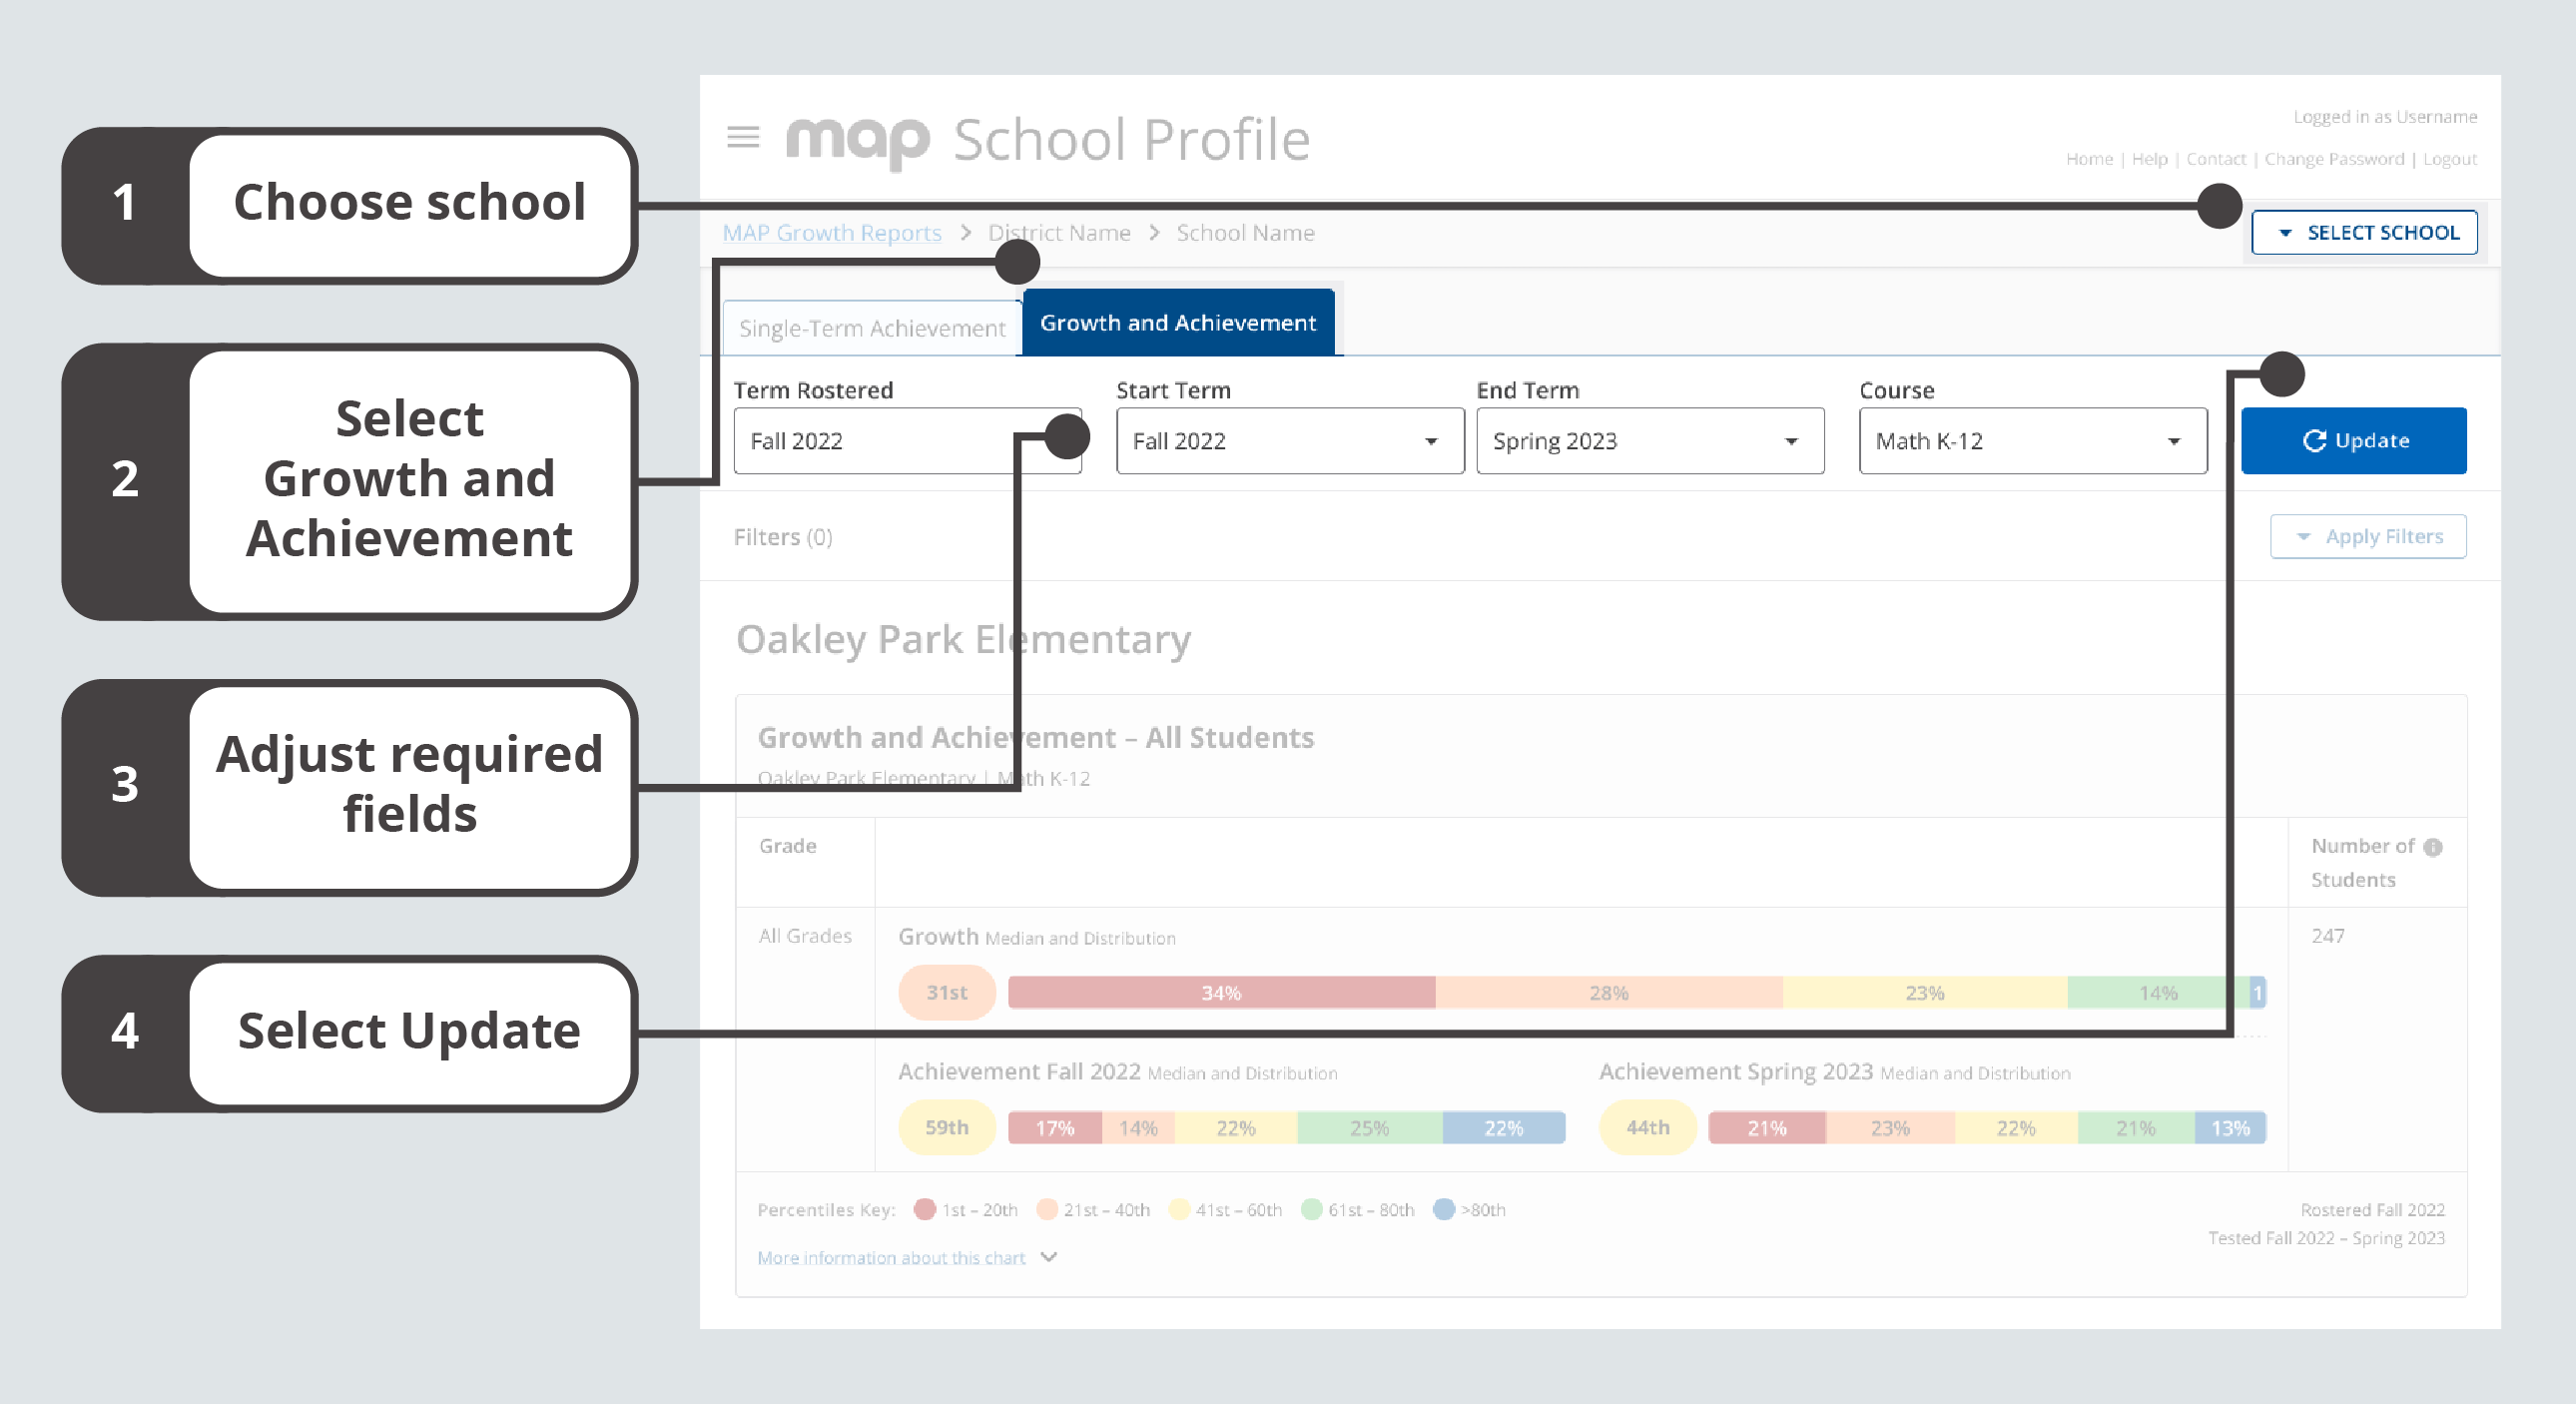
Steps for getting growth and achievement data across two terms
Adjusting required fields on the Growth and Achievement tab
When you access the School Profile report, the required fields will be populated with default values. You may want to adjust the values to better meet your needs. Table 4 explains the required fields.
| Required Field | Explanation |
|---|---|
| Term Rostered |
The term that reflects the rostering relationships (for example, students in classes, classes in grades, etc.) that you’re interested in viewing. You may choose the current term or a previous term. Note: The report will only display data based on students rostered in this term, even if other students have valid growth measures in both terms tested. |
| Start Term |
The term with the test events you want to see, and in this case, the earlier of the two terms you are considering. For example, in the spring you might want to review results from the previous spring as the Start Term to the current spring term as the End Term. You may choose from the available terms that took place before the selected End Term. Note: Only some pairs of terms will be available based on the Growth Comparison Period. |
| End Term |
The term with the test events you want to see, and in this case, the later of the two terms you are considering. For example, in the spring you might want to review results from the previous spring as the Start Term to the current spring term as the End Term. You may choose the same term as the term rostered or an earlier term that took place after the selected Start Term. Note: The School Profile report is available for all fall, winter, and spring terms, beginning with academic year 2020–2021. |
| Course |
A specific test and/or a grouping of tests licensed to a school, district, or state. |
Applying optional filters on the Growth and Achievement tab
You can apply the same filters from the Single-Term Achievement tab to the Growth and Achievement tab. To learn more, refer to instructions for Adding optional filters and Clearing optional filters.
Understanding growth and achievement medians and distributions
For each grade, you can review growth and achievement comparisons through the median percentiles and distributions of any data that’s available across both selected terms. You can also find the number of students in the grade who have valid growth measures in both terms.
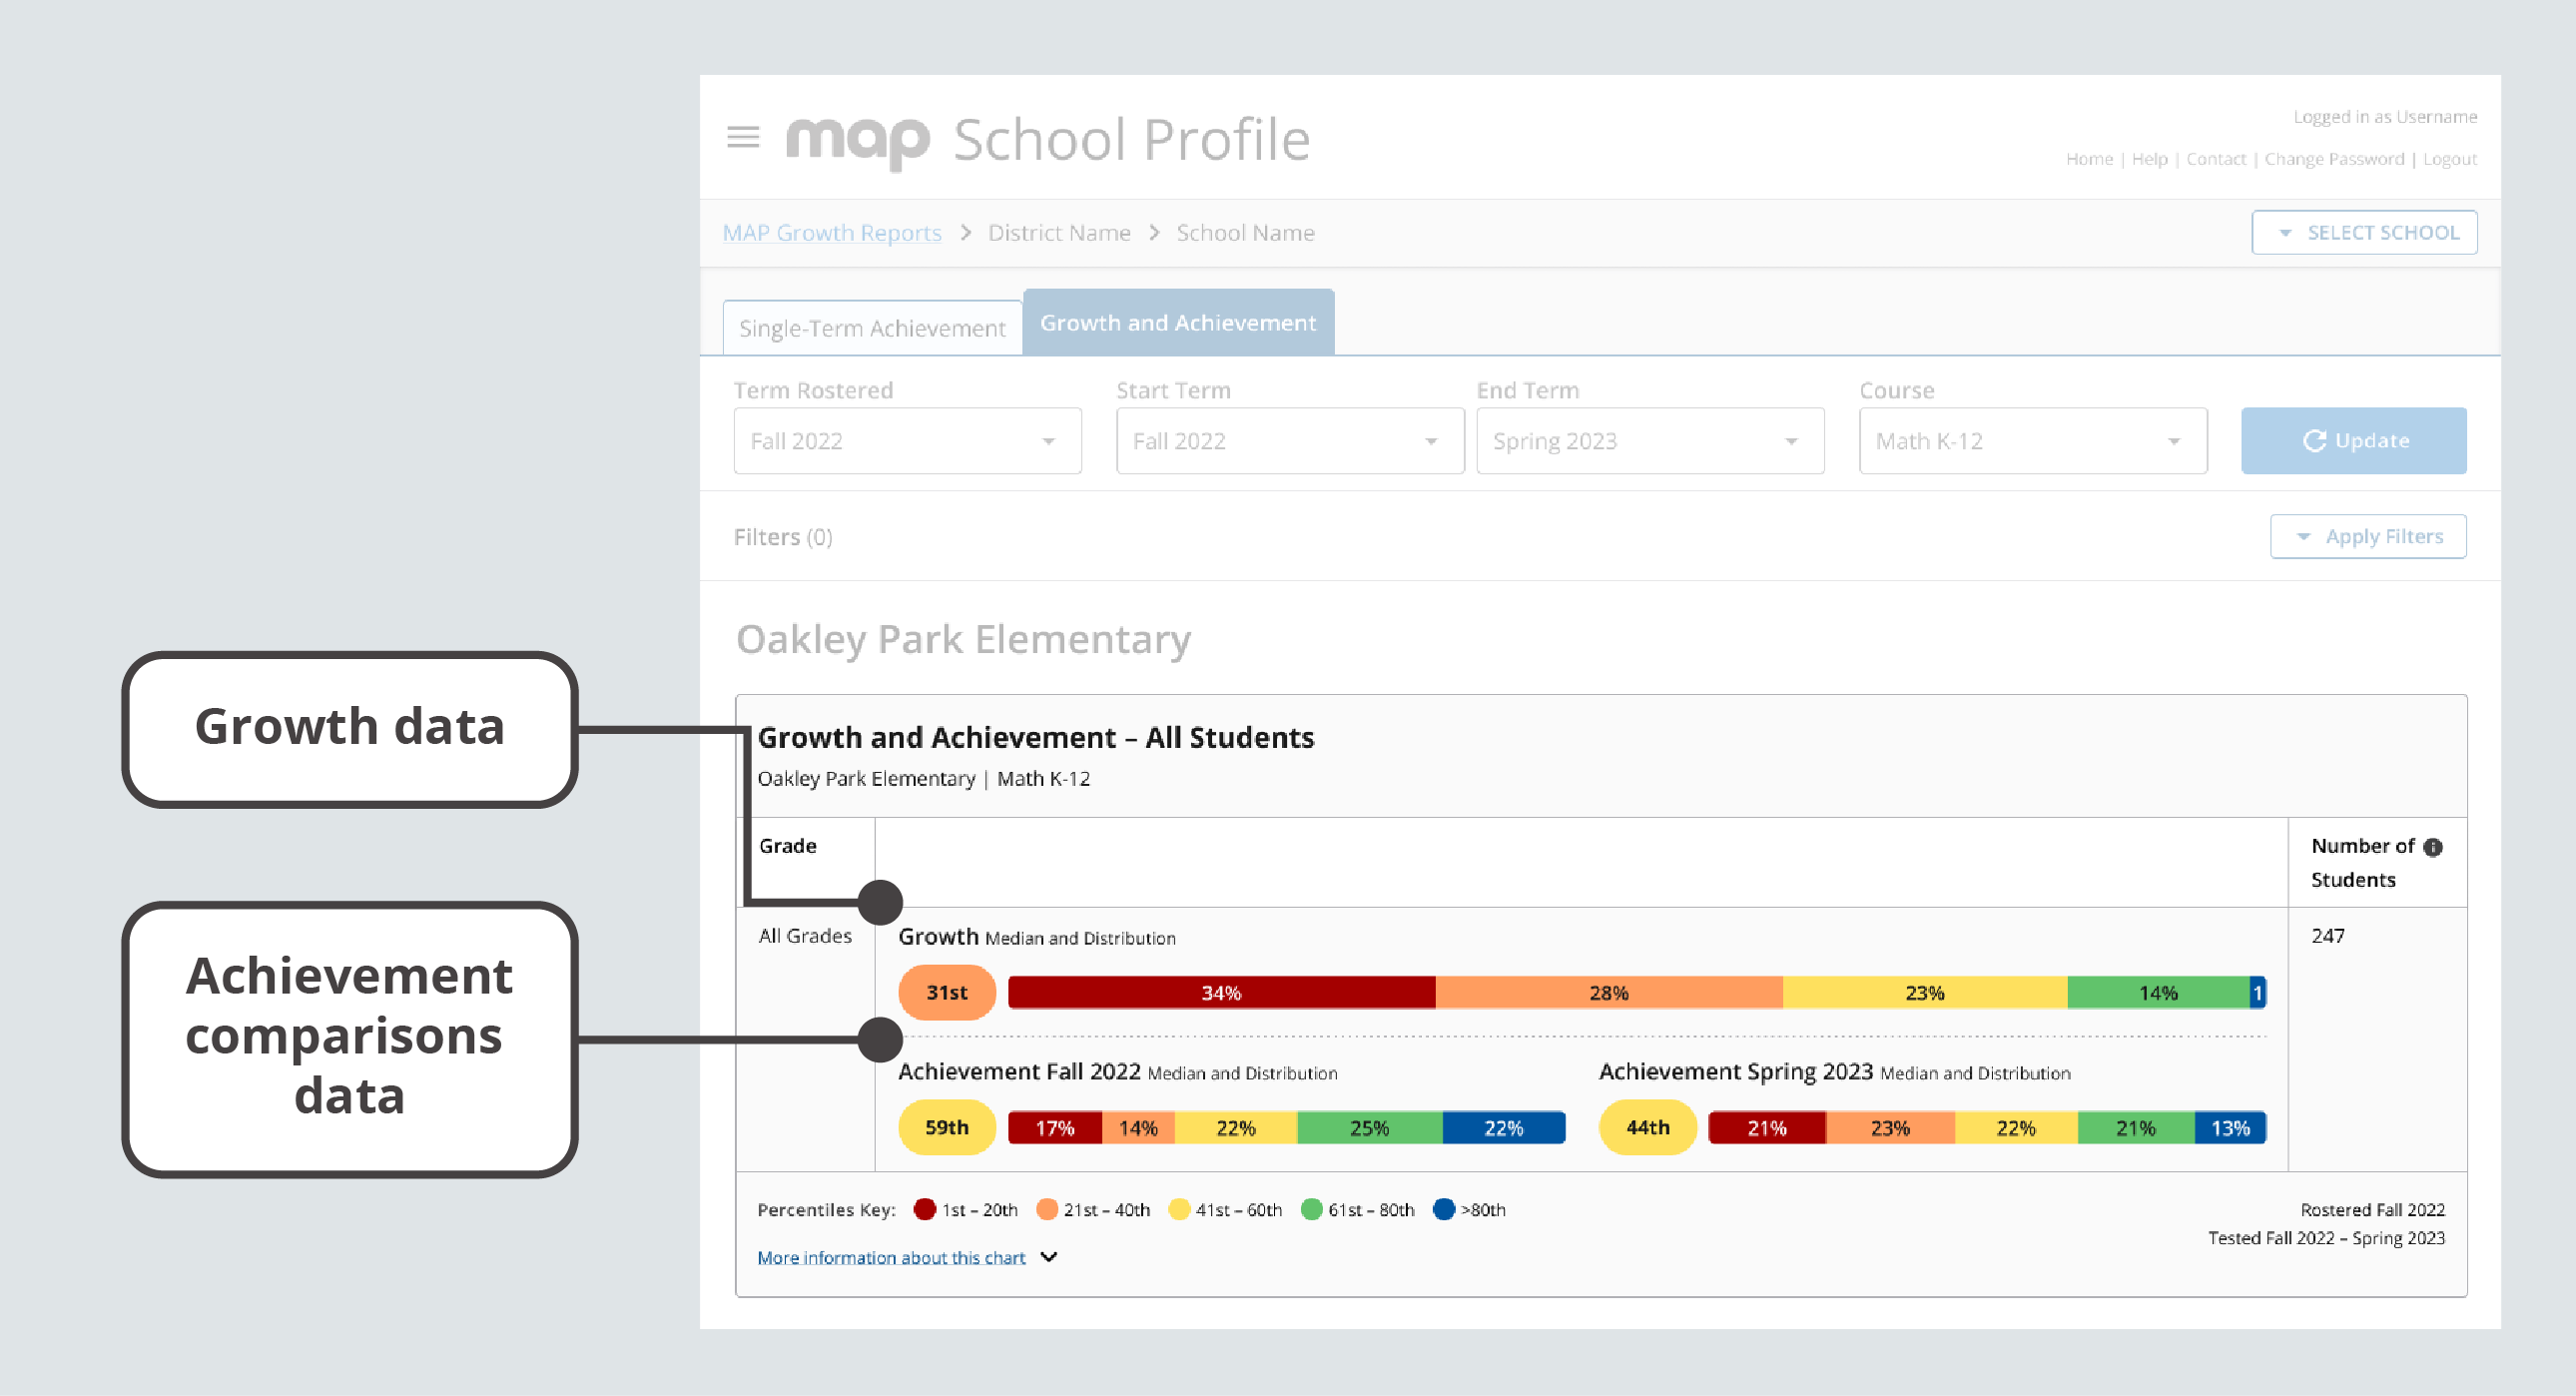
Median and distribution data on the Growth and Achievement tab
For a visual explanation of how the data is arranged, consider the diagram below.
Visualization with median percentile and distribution labeled
| Data Point | Explanation |
|---|---|
| Growth | Growth is an inference about how student performance changes across two test events. You can use growth percentiles to understand how changes in student scores compare to changes in other US student scores. |
| Achievement Comparisons | Student performance at two different test events. You can use achievement comparisons to understand how a group of student scores has changed across two test events. |
| Percentile | Norm-based information about where a student’s observed score falls within the range of scores produced by other same-grade US students. |
| Median Percentile | The middle percentile when a group of percentiles are ordered from lowest to highest. |
| Distribution | A representation of the range of scores for a group of students, indicating the number and/or percentages of scores within five percentile levels, or quintiles. |
| Quintiles | Five percentile levels based on NWEA normative data: 1st–20th (red), 21st–40th (orange), 41st–60th (yellow), 61st–80th (green), and greater than 80th (blue). |
| Number of Students | The number of students rostered in the selected Term Rostered field with a valid growth measure in both of the selected Term Tested fields. For more details about growth measures, explore Invalid Tests and Unofficial RIT Scores. |
Navigating to the Growth and Achievement Quadrant
In addition to medians and distributions, the Growth and Achievement tab offers a quadrant view of growth and achievement data across two terms. After following instructions for adjusting the required fields and applying optional filters, you can access the Growth and Achievement Quadrant:
-
Scroll down beneath the Growth and Achievement Overview to find the Growth and Achievement Quadrant.
-
Adjust the term for achievement data as necessary.
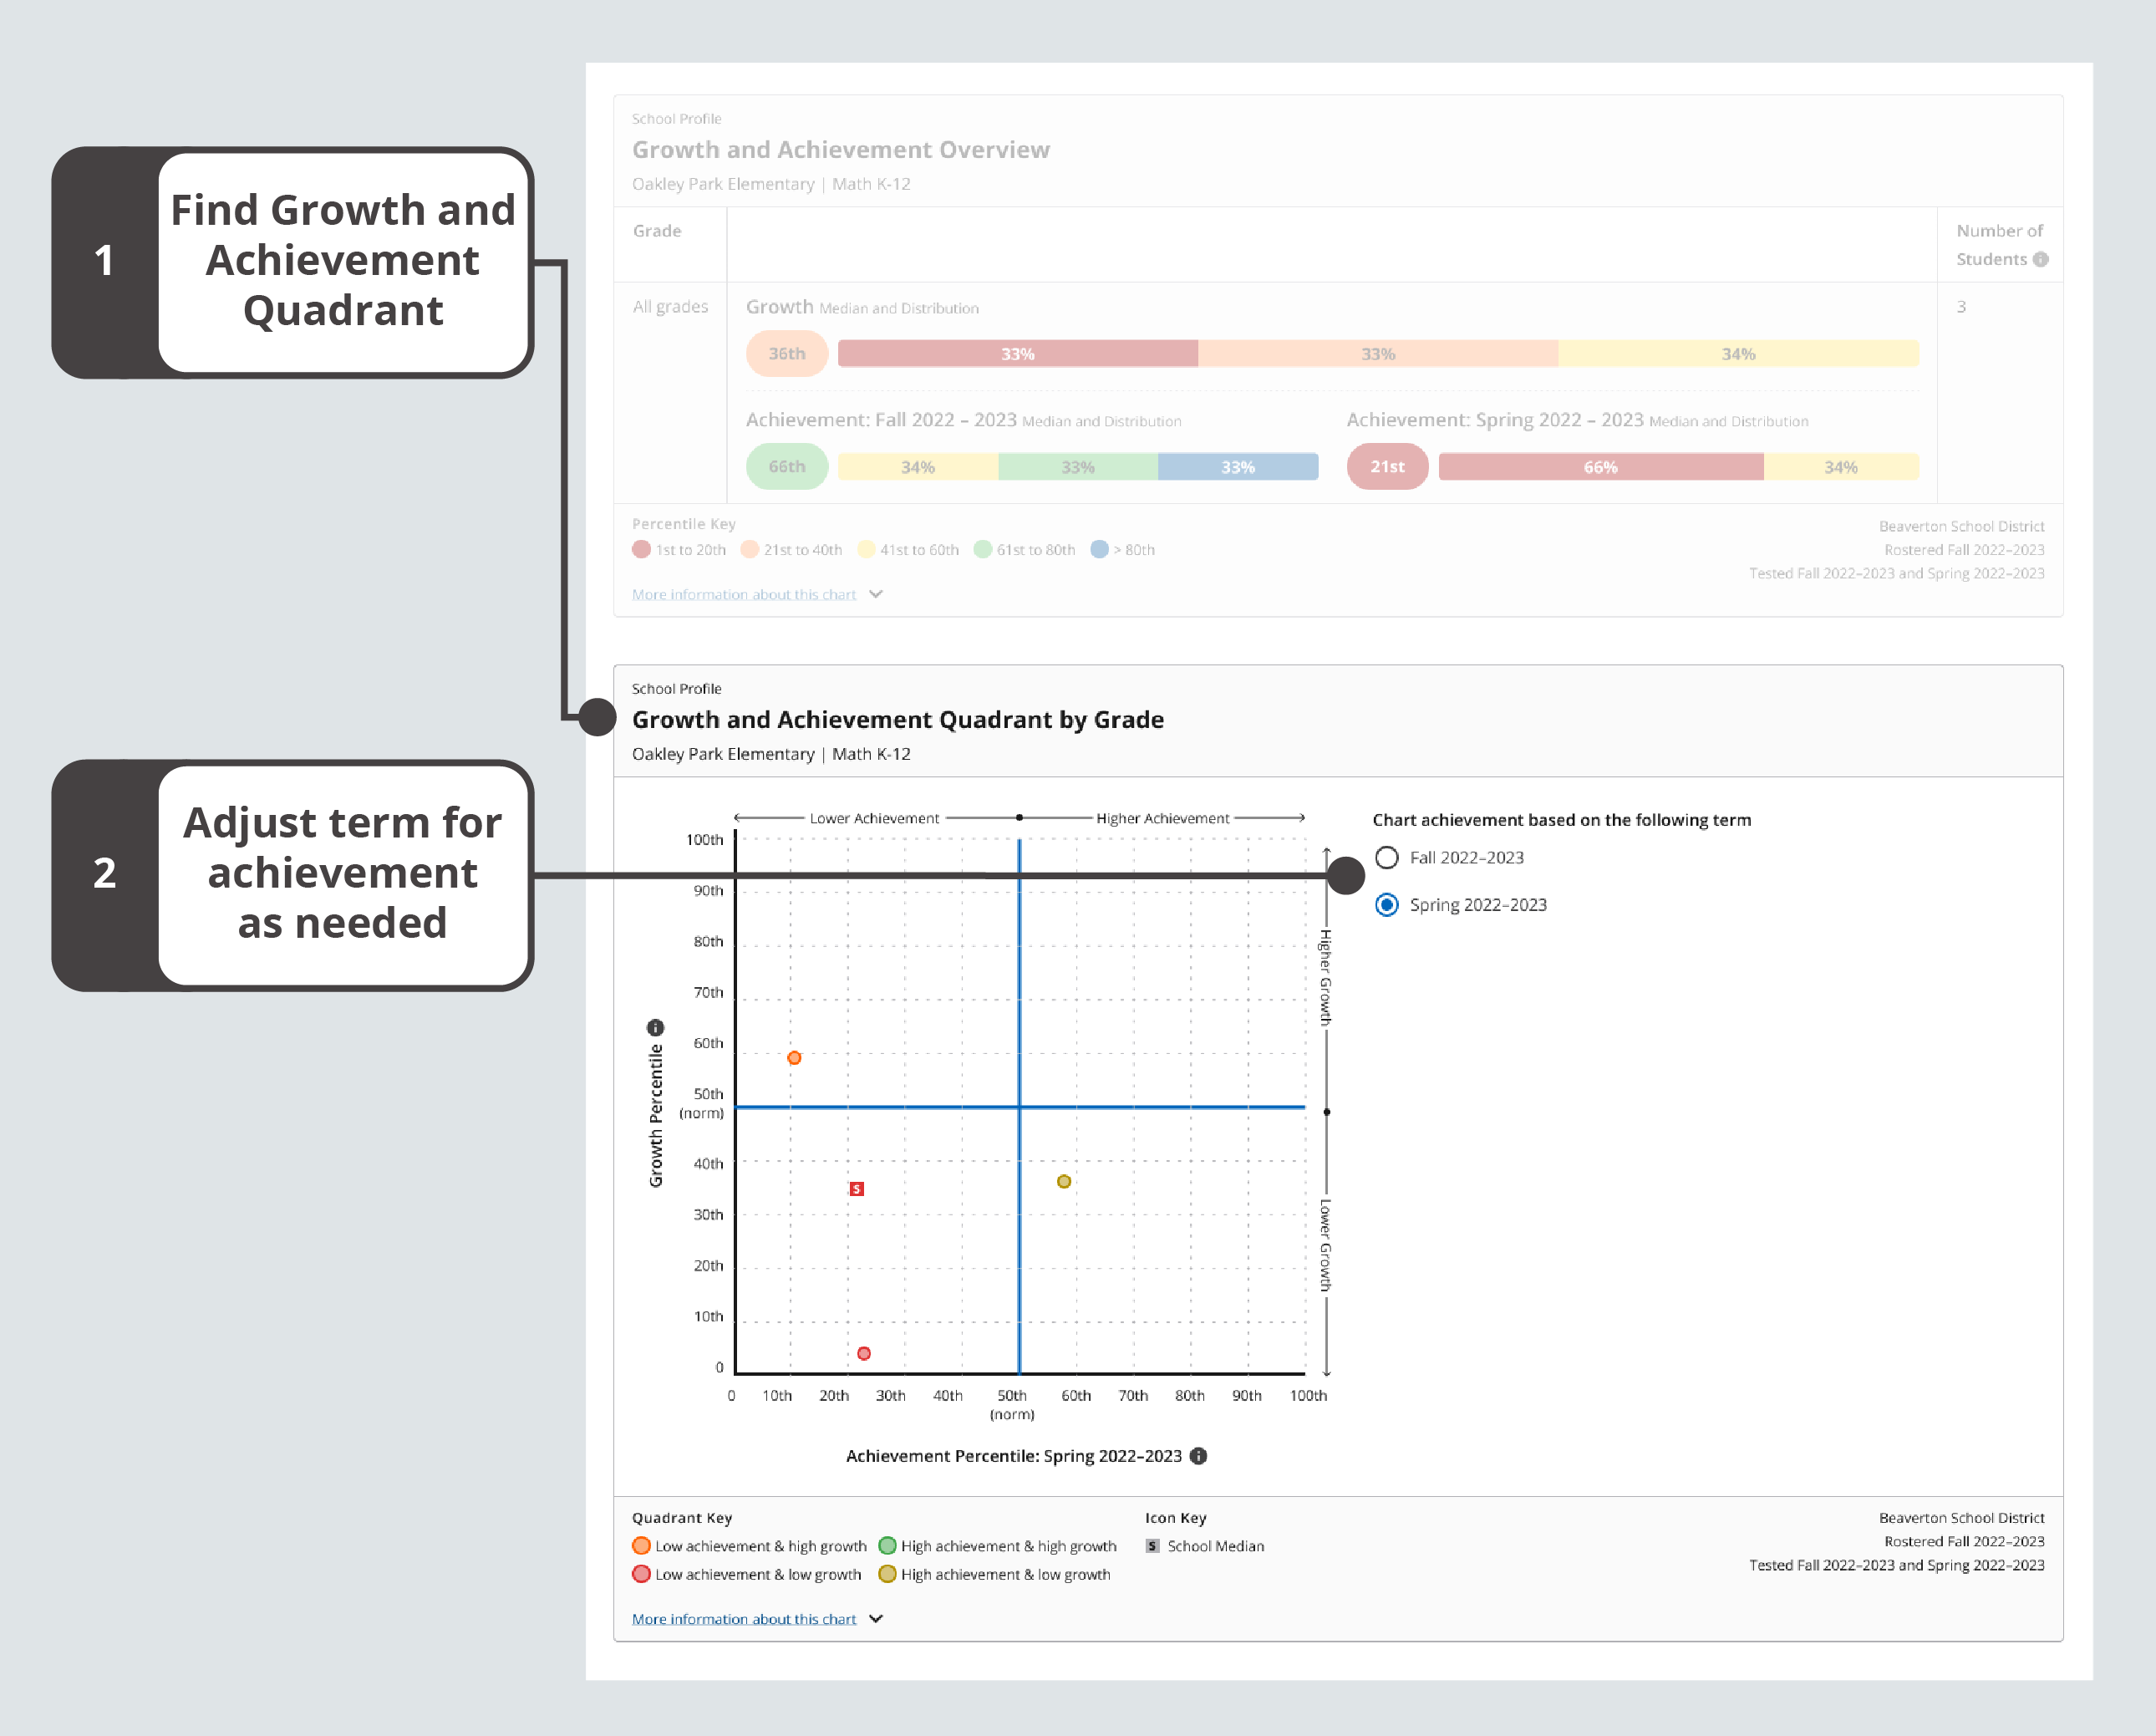
Steps for accessing the Growth and Achievement Quadrant and selecting a term for achievement data
Understanding the Growth and Achievement Quadrant
Each circular point on the chart represents a grade. You’ll see one point for each grade in your school.
The X-axis position shows the grade’s median achievement percentile. This is a measure of how the grade performed in a single term (either the Start Term or End Term, depending on your selection to the right of the quadrant).
The Y-axis position shows the grade’s median growth percentile. This is a measure of the grade’s growth between the Start Term and End Term.
You’ll also see a square with an “S” in it, which represents the entire school. The placement of the square is based on the school’s median achievement and median growth percentiles.
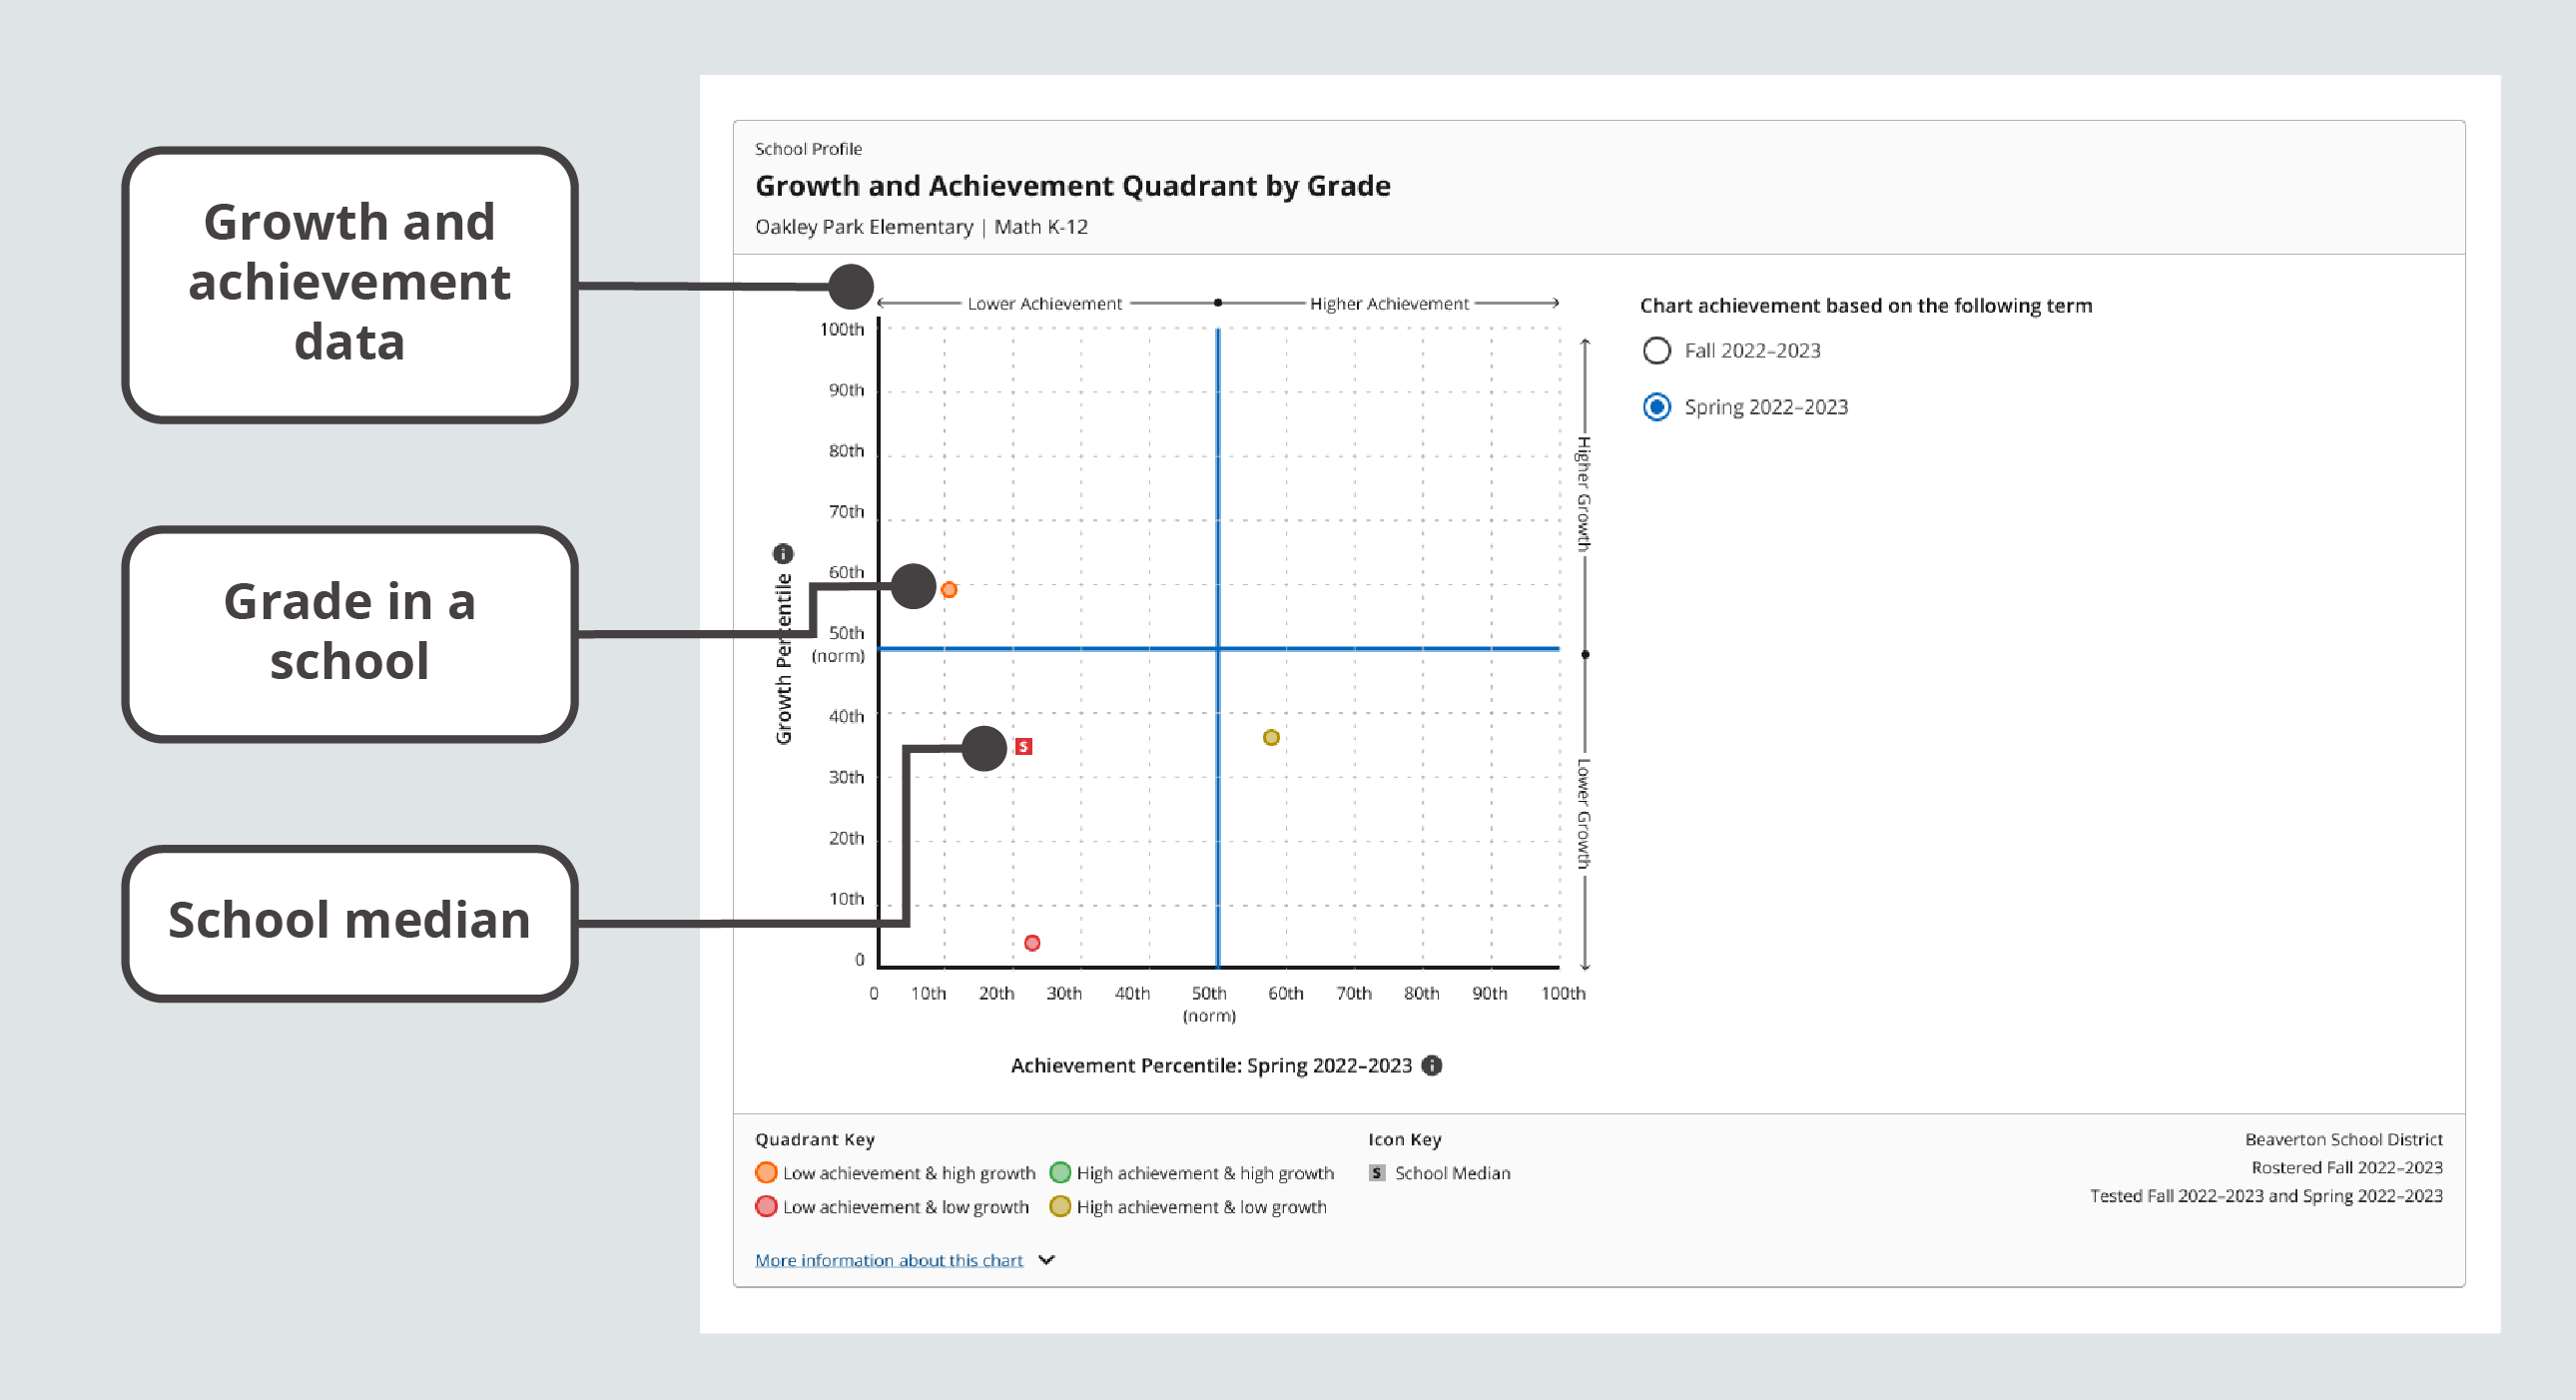
Growth and Achievement Quadrant data
For a visual explanation of how the data is arranged, consider the diagram below.
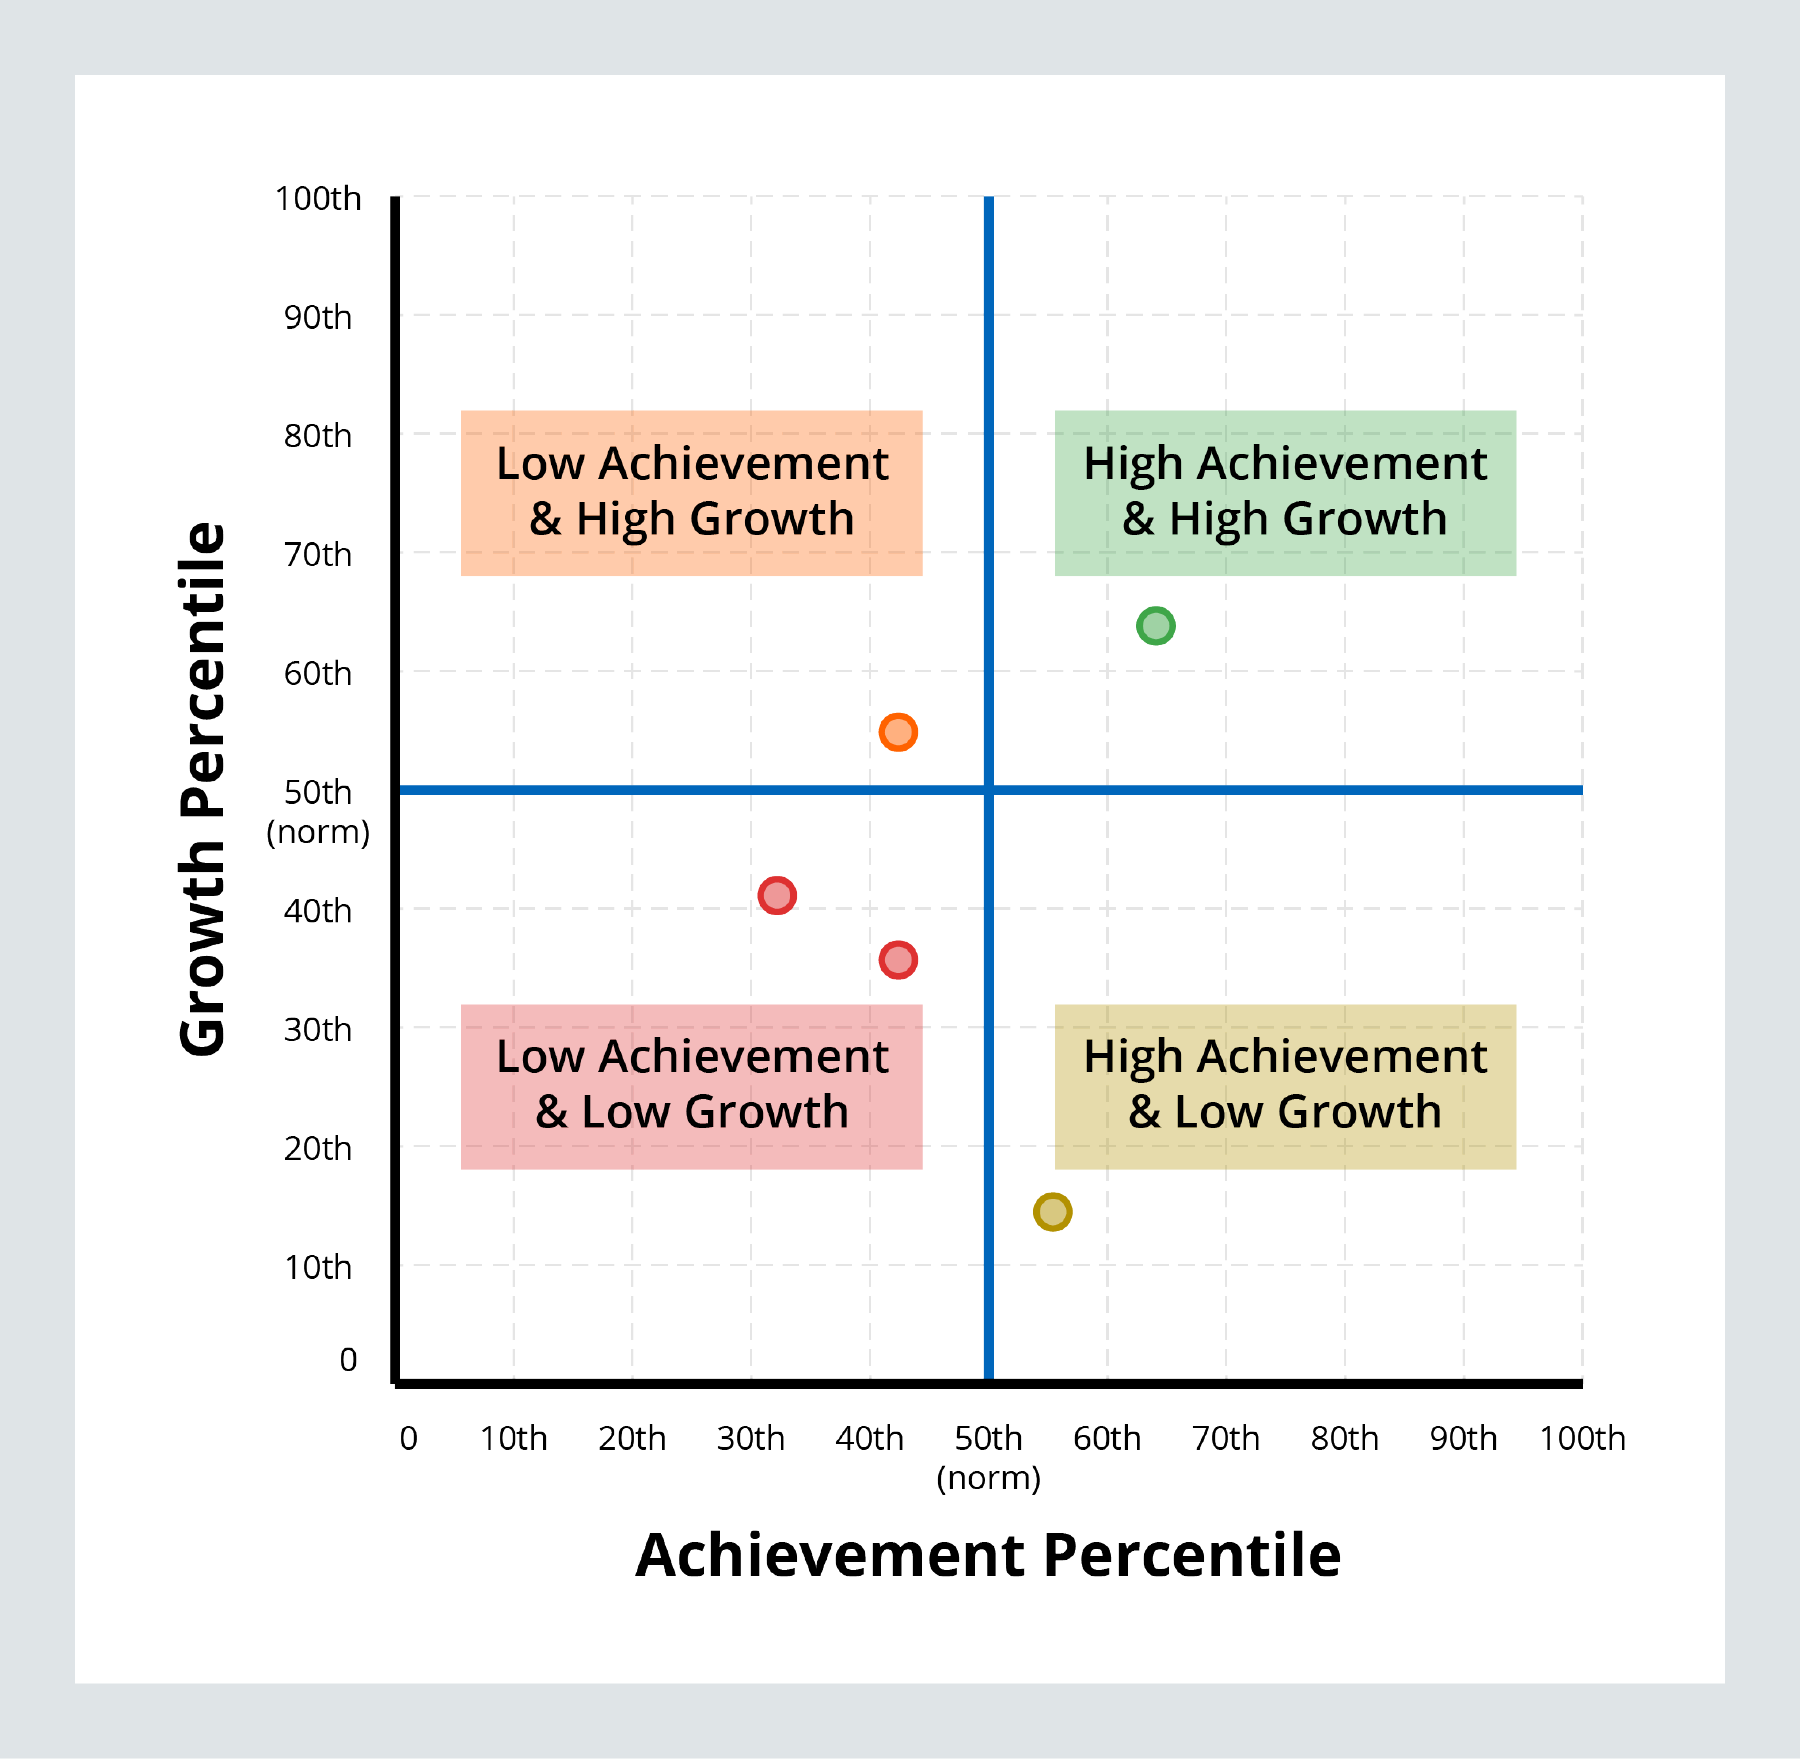
Visualization with each quadrant labeled
| Data Point | Explanation |
|---|---|
| Growth Percentile | A percentile ranking based on MAP Growth Norms for observed growth between two testing terms. The graph shows the median (middle) percentile for a group of students. |
| Achievement Percentile | A percentile ranking based on MAP Growth Norms for achievement in one testing term. The graph shows the median (middle) percentile for a group of students. |
| Norm | The 50th percentile. Represents typical achievement/typical growth based on MAP Growth Norms. |
| Median | The middle value when a group of values is ordered from lowest to highest. |
Reviewing data for classes in a grade
Both tabs of the School Profile report offer data for all the classes in a grade.
Finding classes on the Single-Term Achievement tab
To find single-term achievement data for all the classes in a grade:
-
Select a grade.
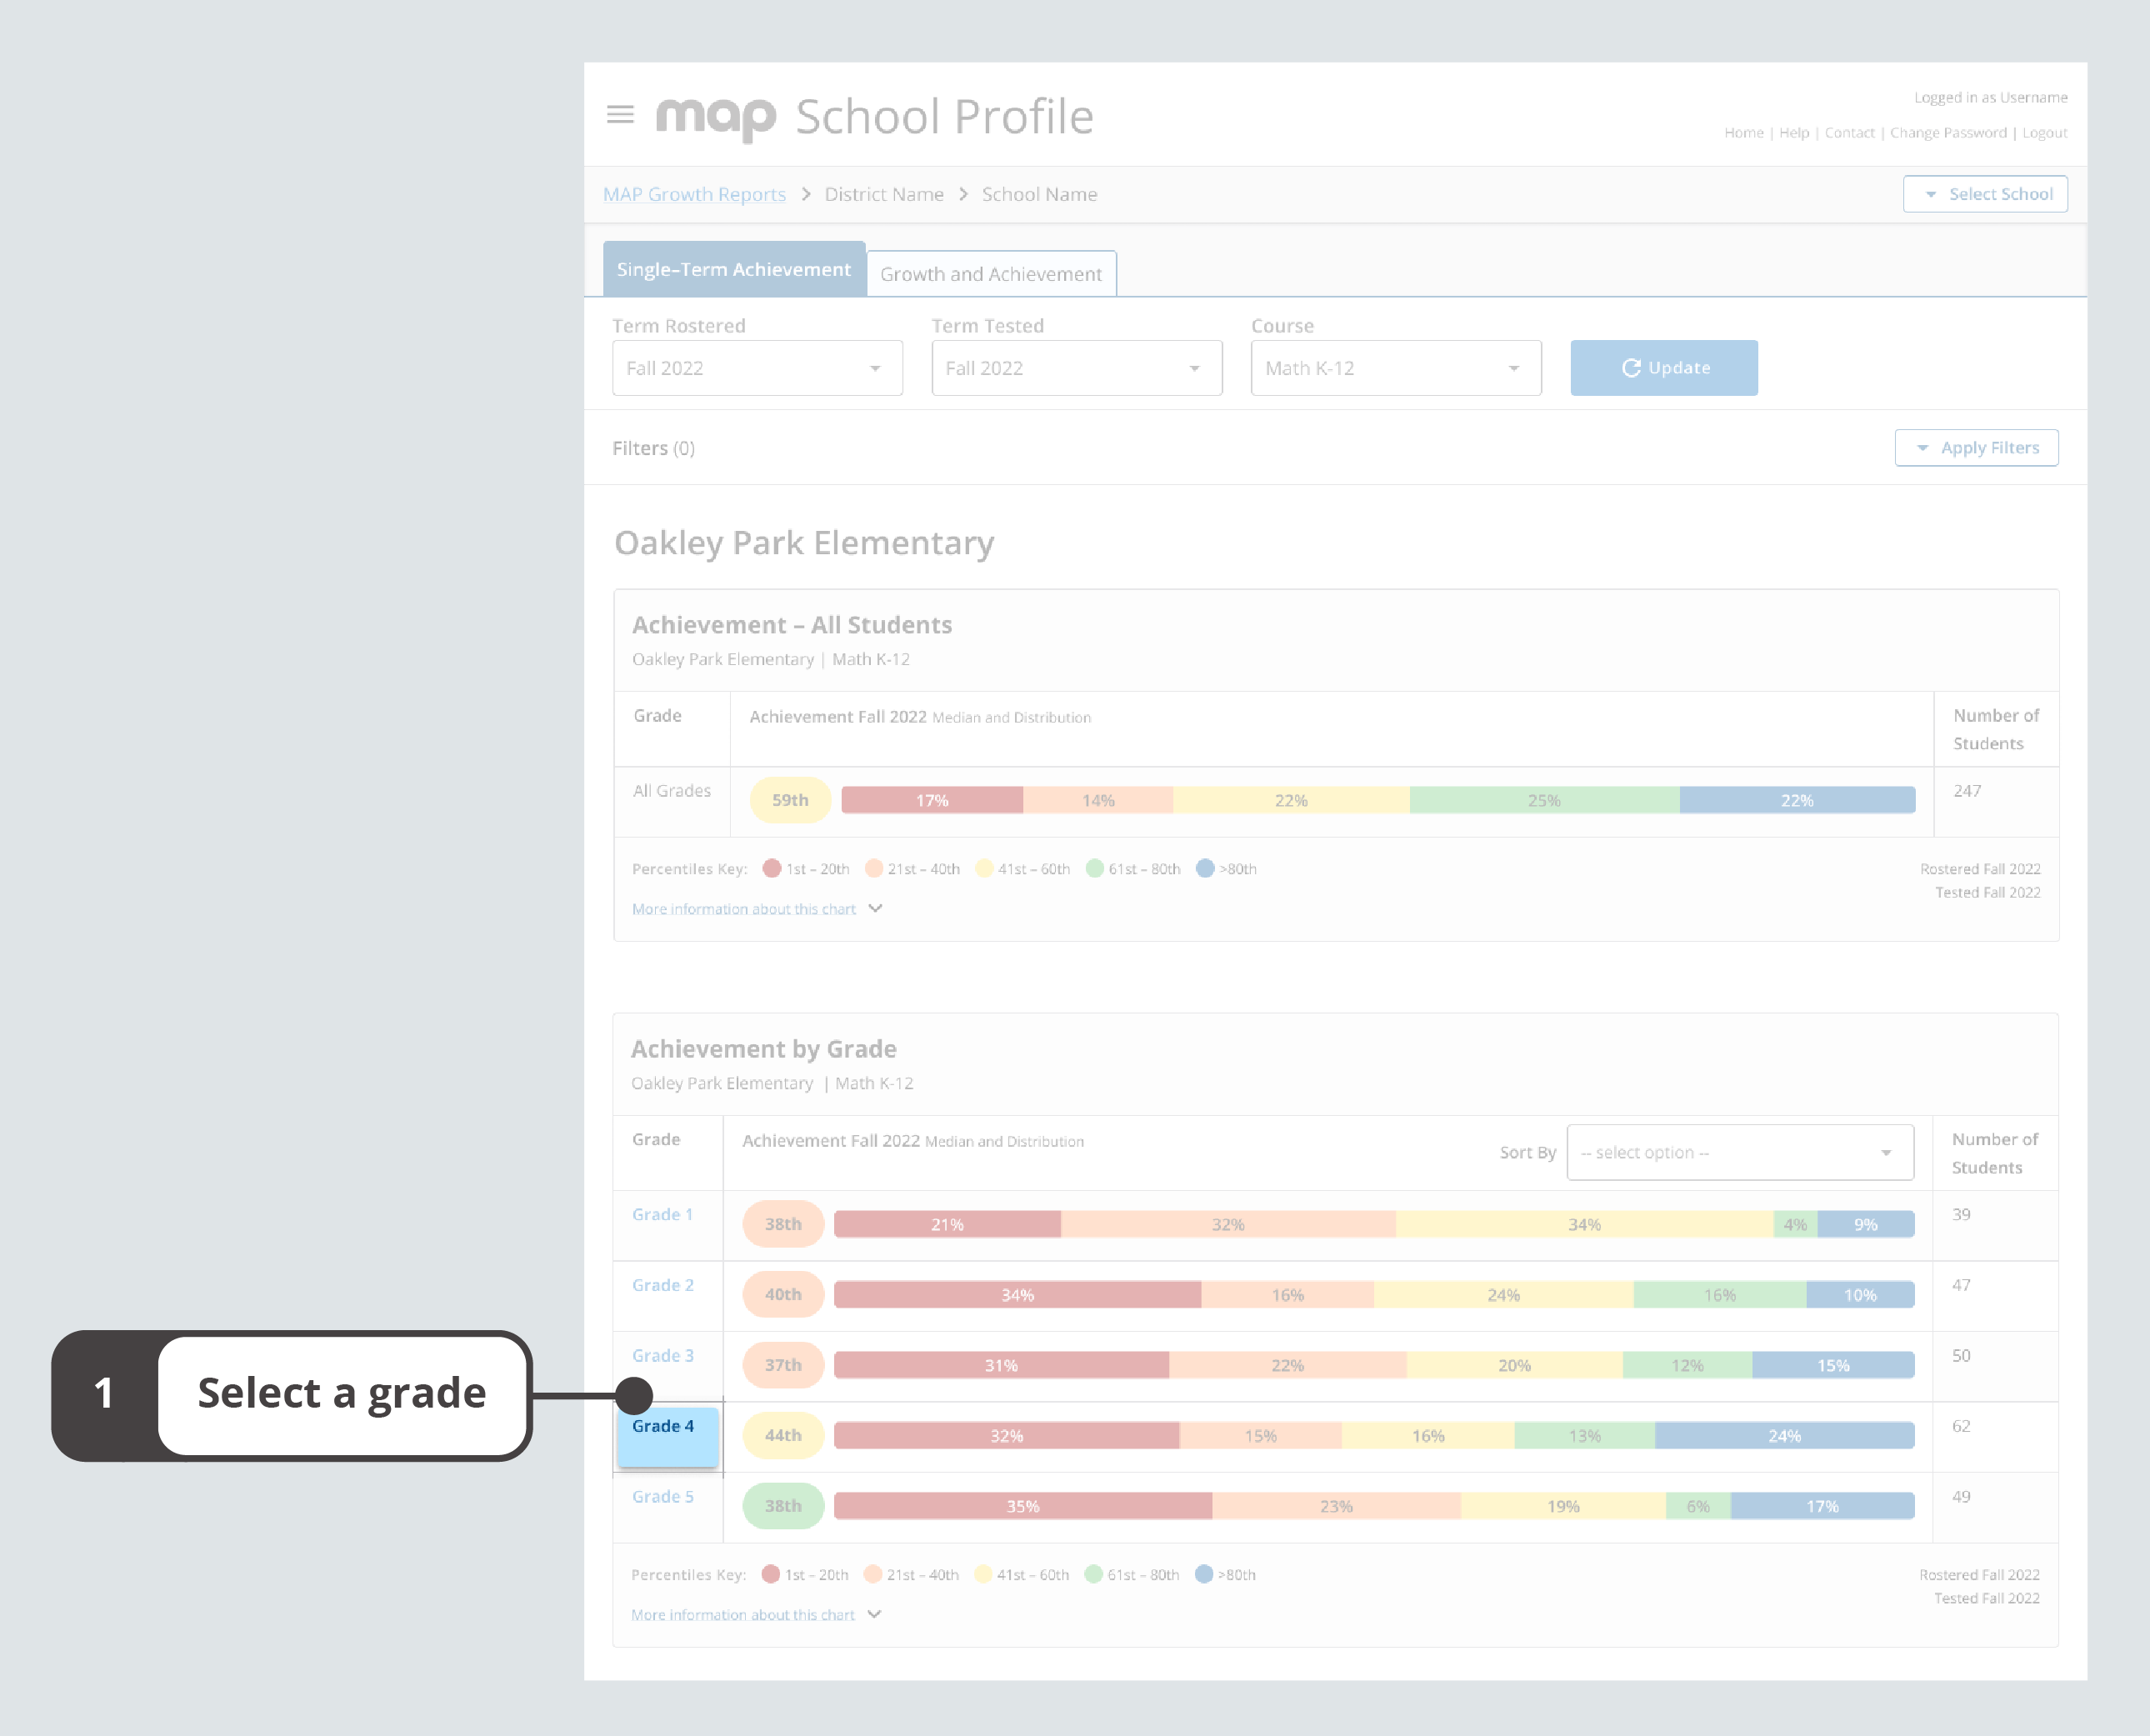
Single-Term Achievement tab with a grade selected
-
Explore data. You can sort the data by any of the column headers.
Note: The displayed data only represents students who are rostered to the selected grade. For classes with students in multiple grades, review each grade at a time or visit the Class Profile Report.
-
Select All grades to return to a view of all the grades.
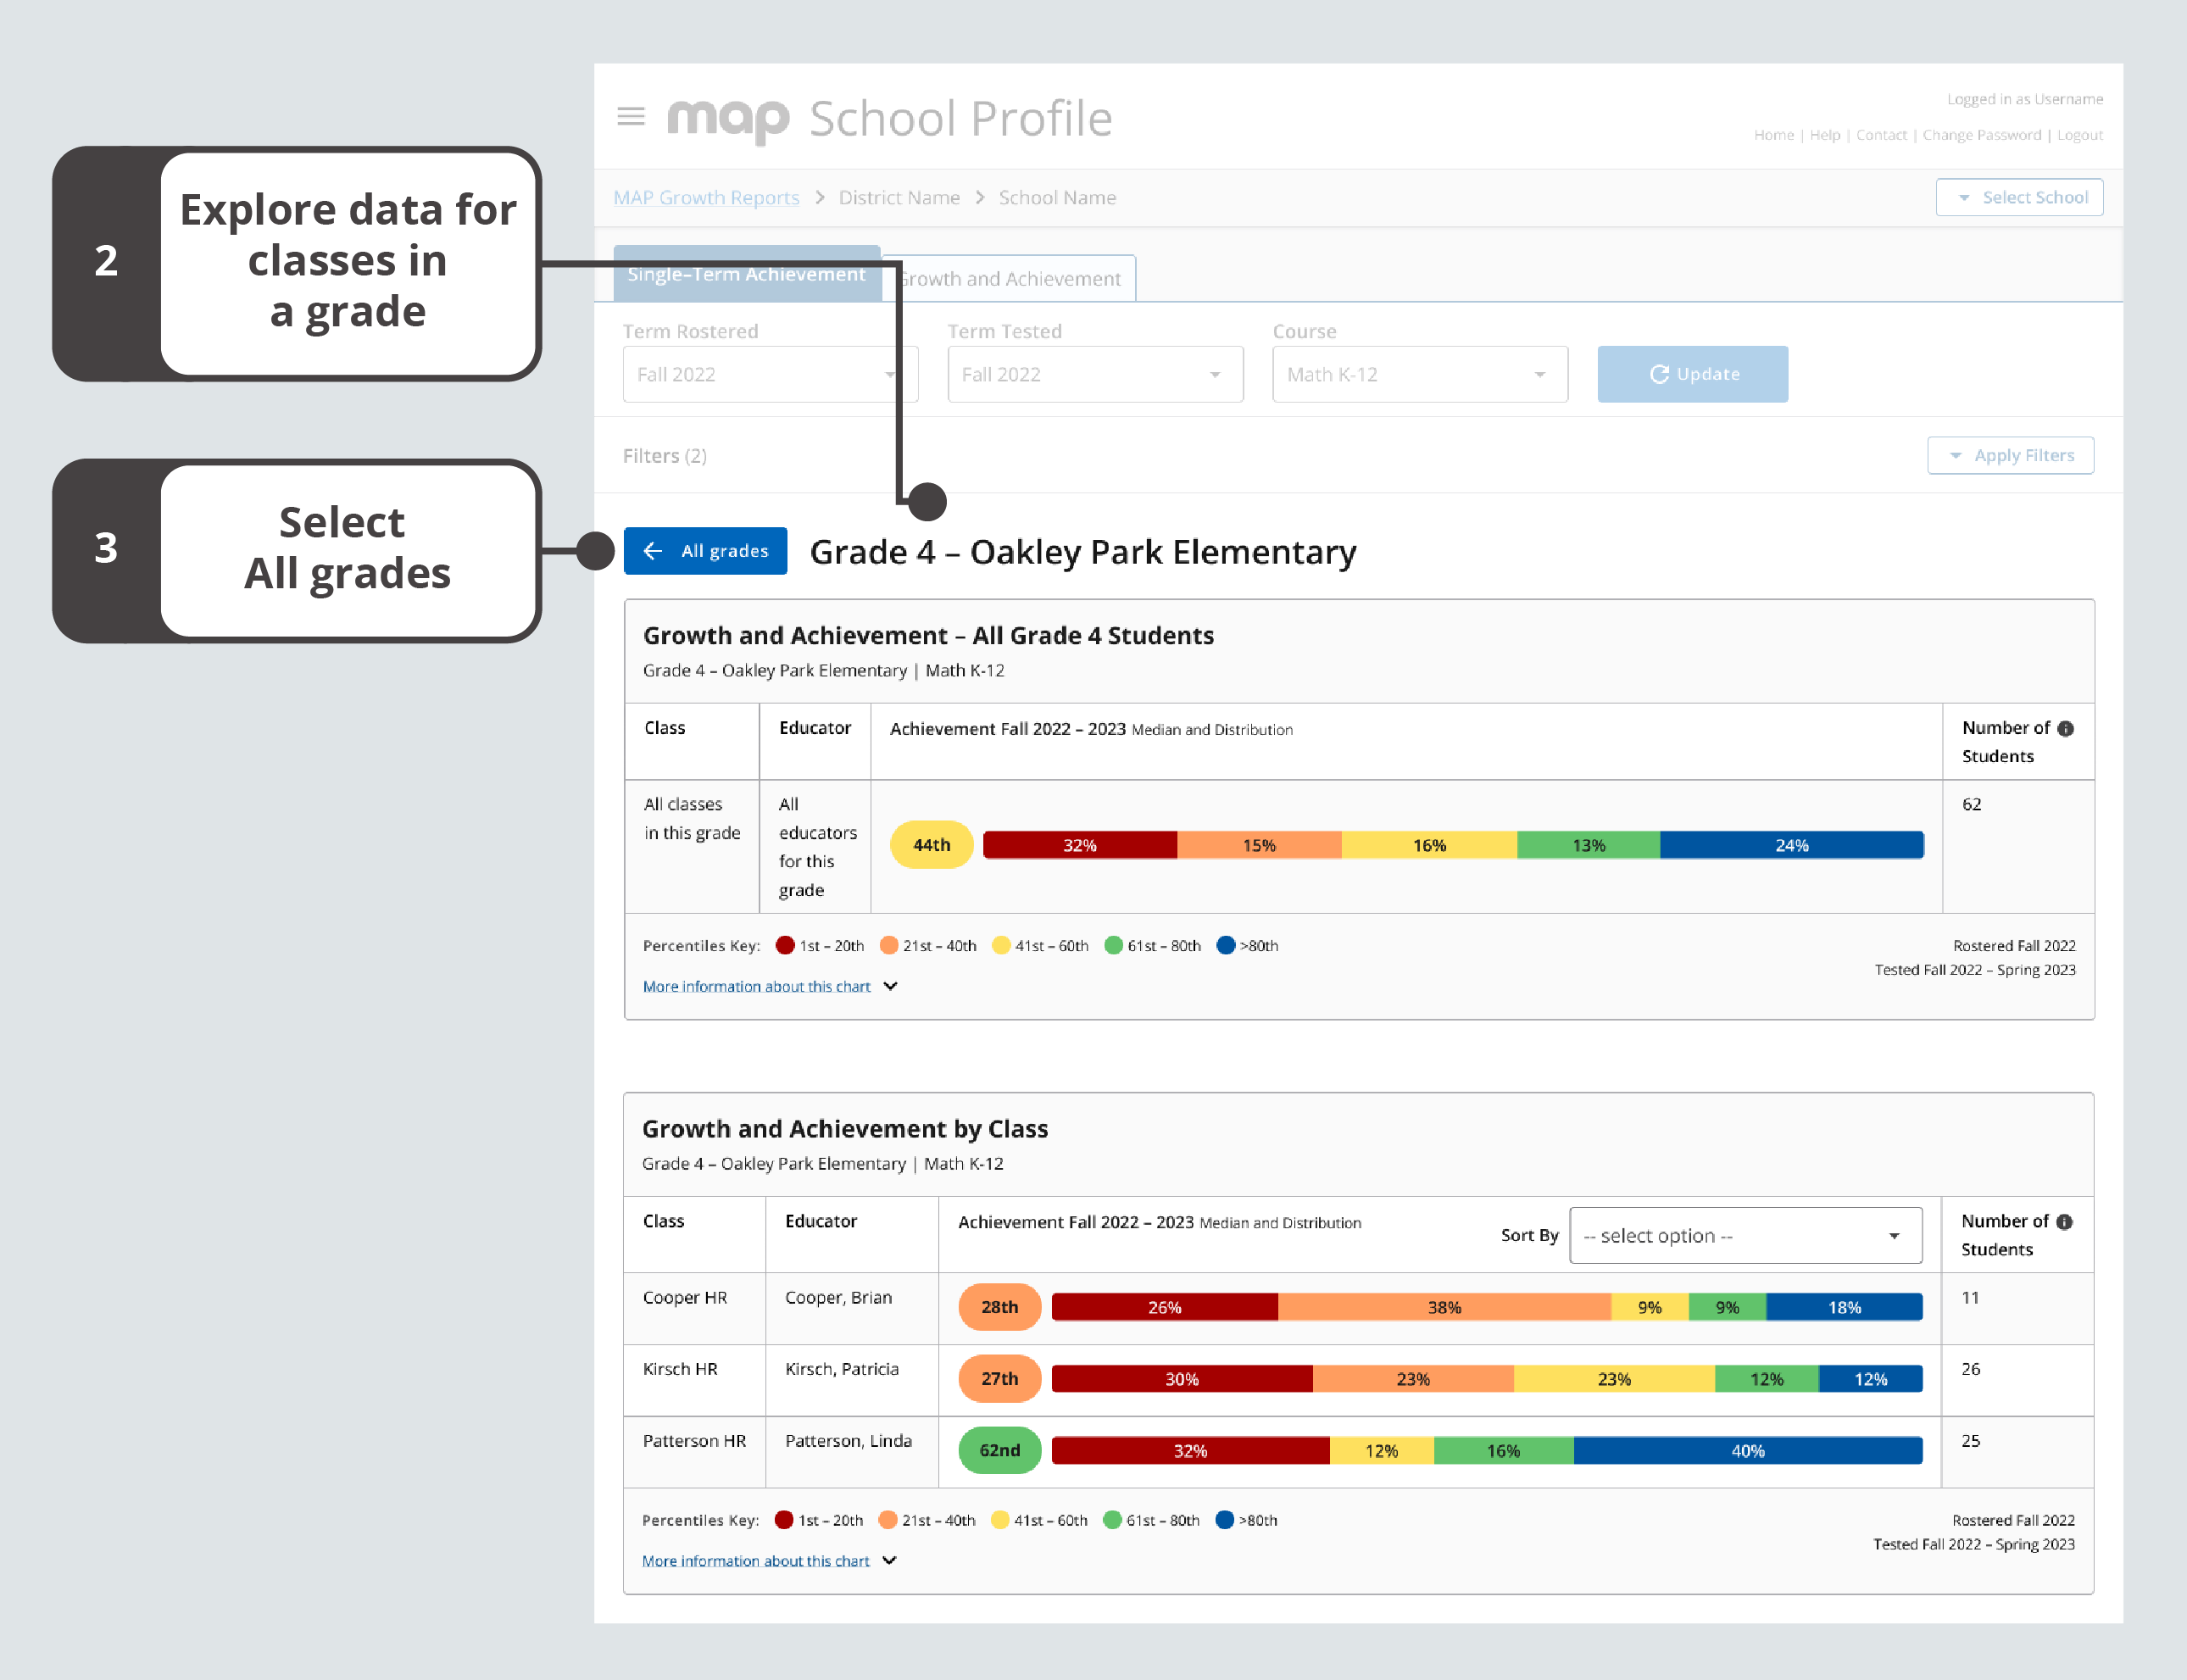
Single-Term Achievement tab with all classes in a grade
Finding classes on the Growth and Achievement tab
To access growth and achievement data for all classes in a grade, you can follow the instructions listed in Finding classes on the Single-Term Achievement tab.
You can also find classes through the Growth and Achievement Quadrant:
-
Select a point representing a grade.
-
In the expanded grade information popover, select View grade details.
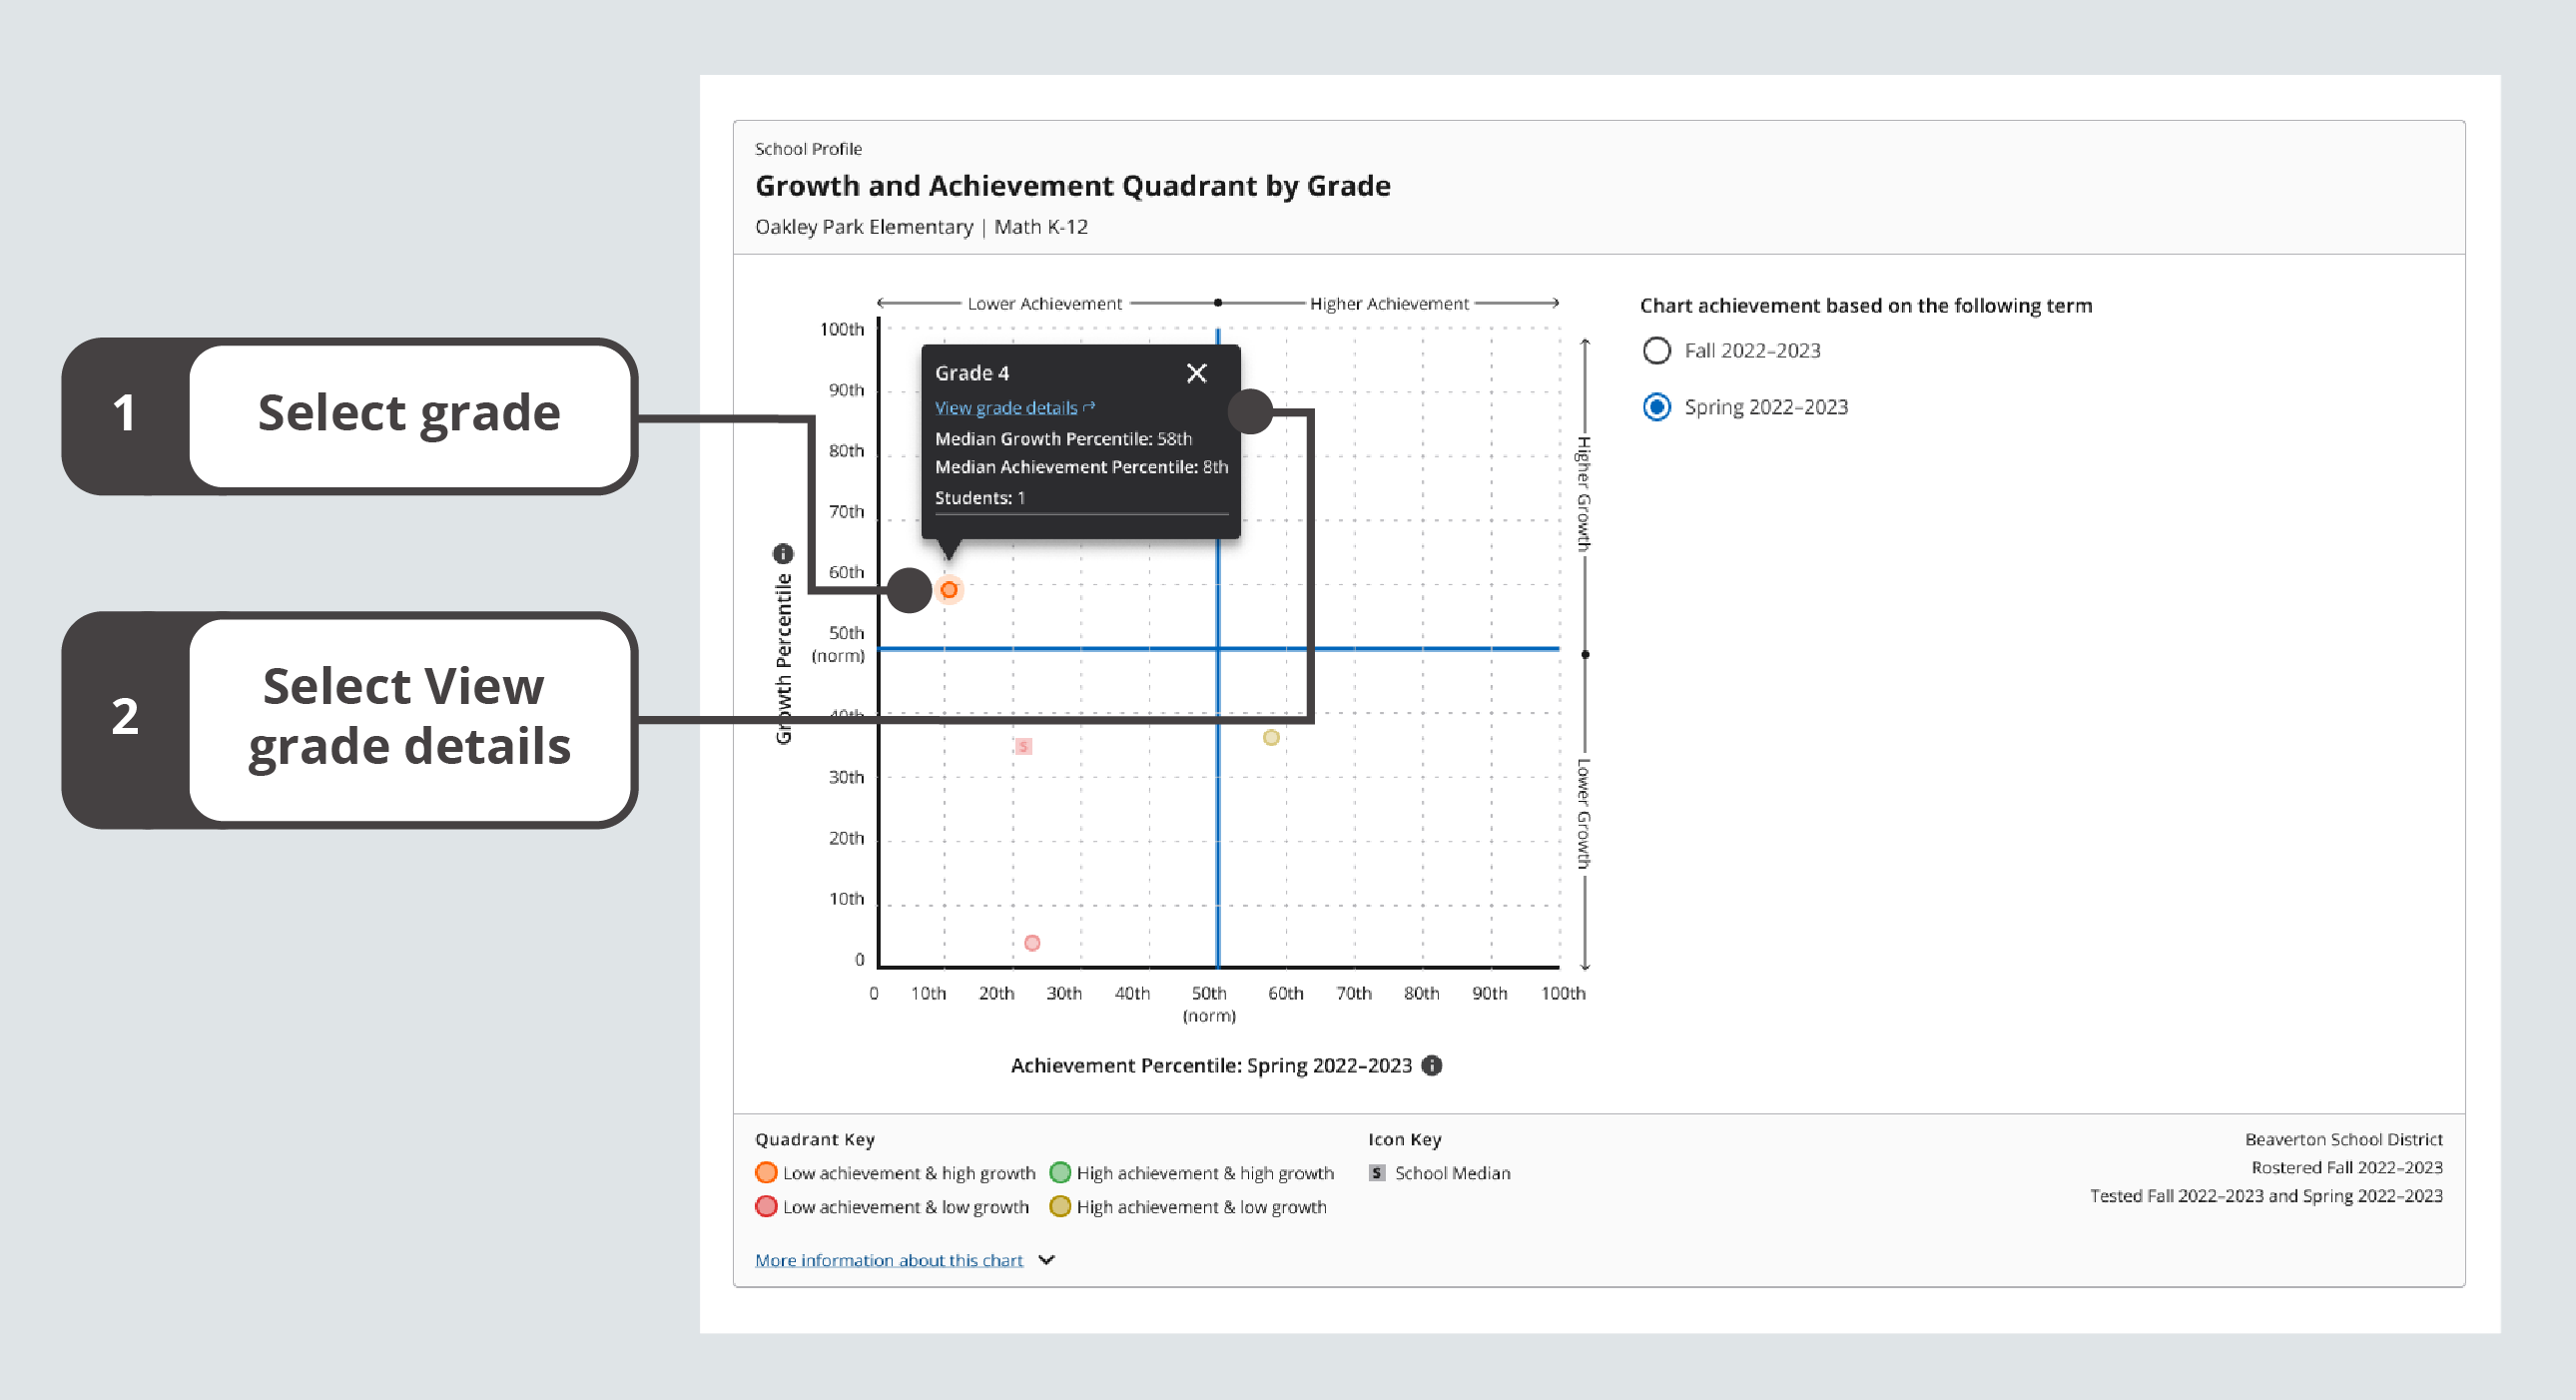
Growth and Achievement Quadrant with an expanded grade information popover
-
Explore data
Note: When reviewing data for all classes in a grade, you find a square with a "G" in it, which represents median data for the entire grade, as well as a square with an "S" in it, which represents median data for the entire school.
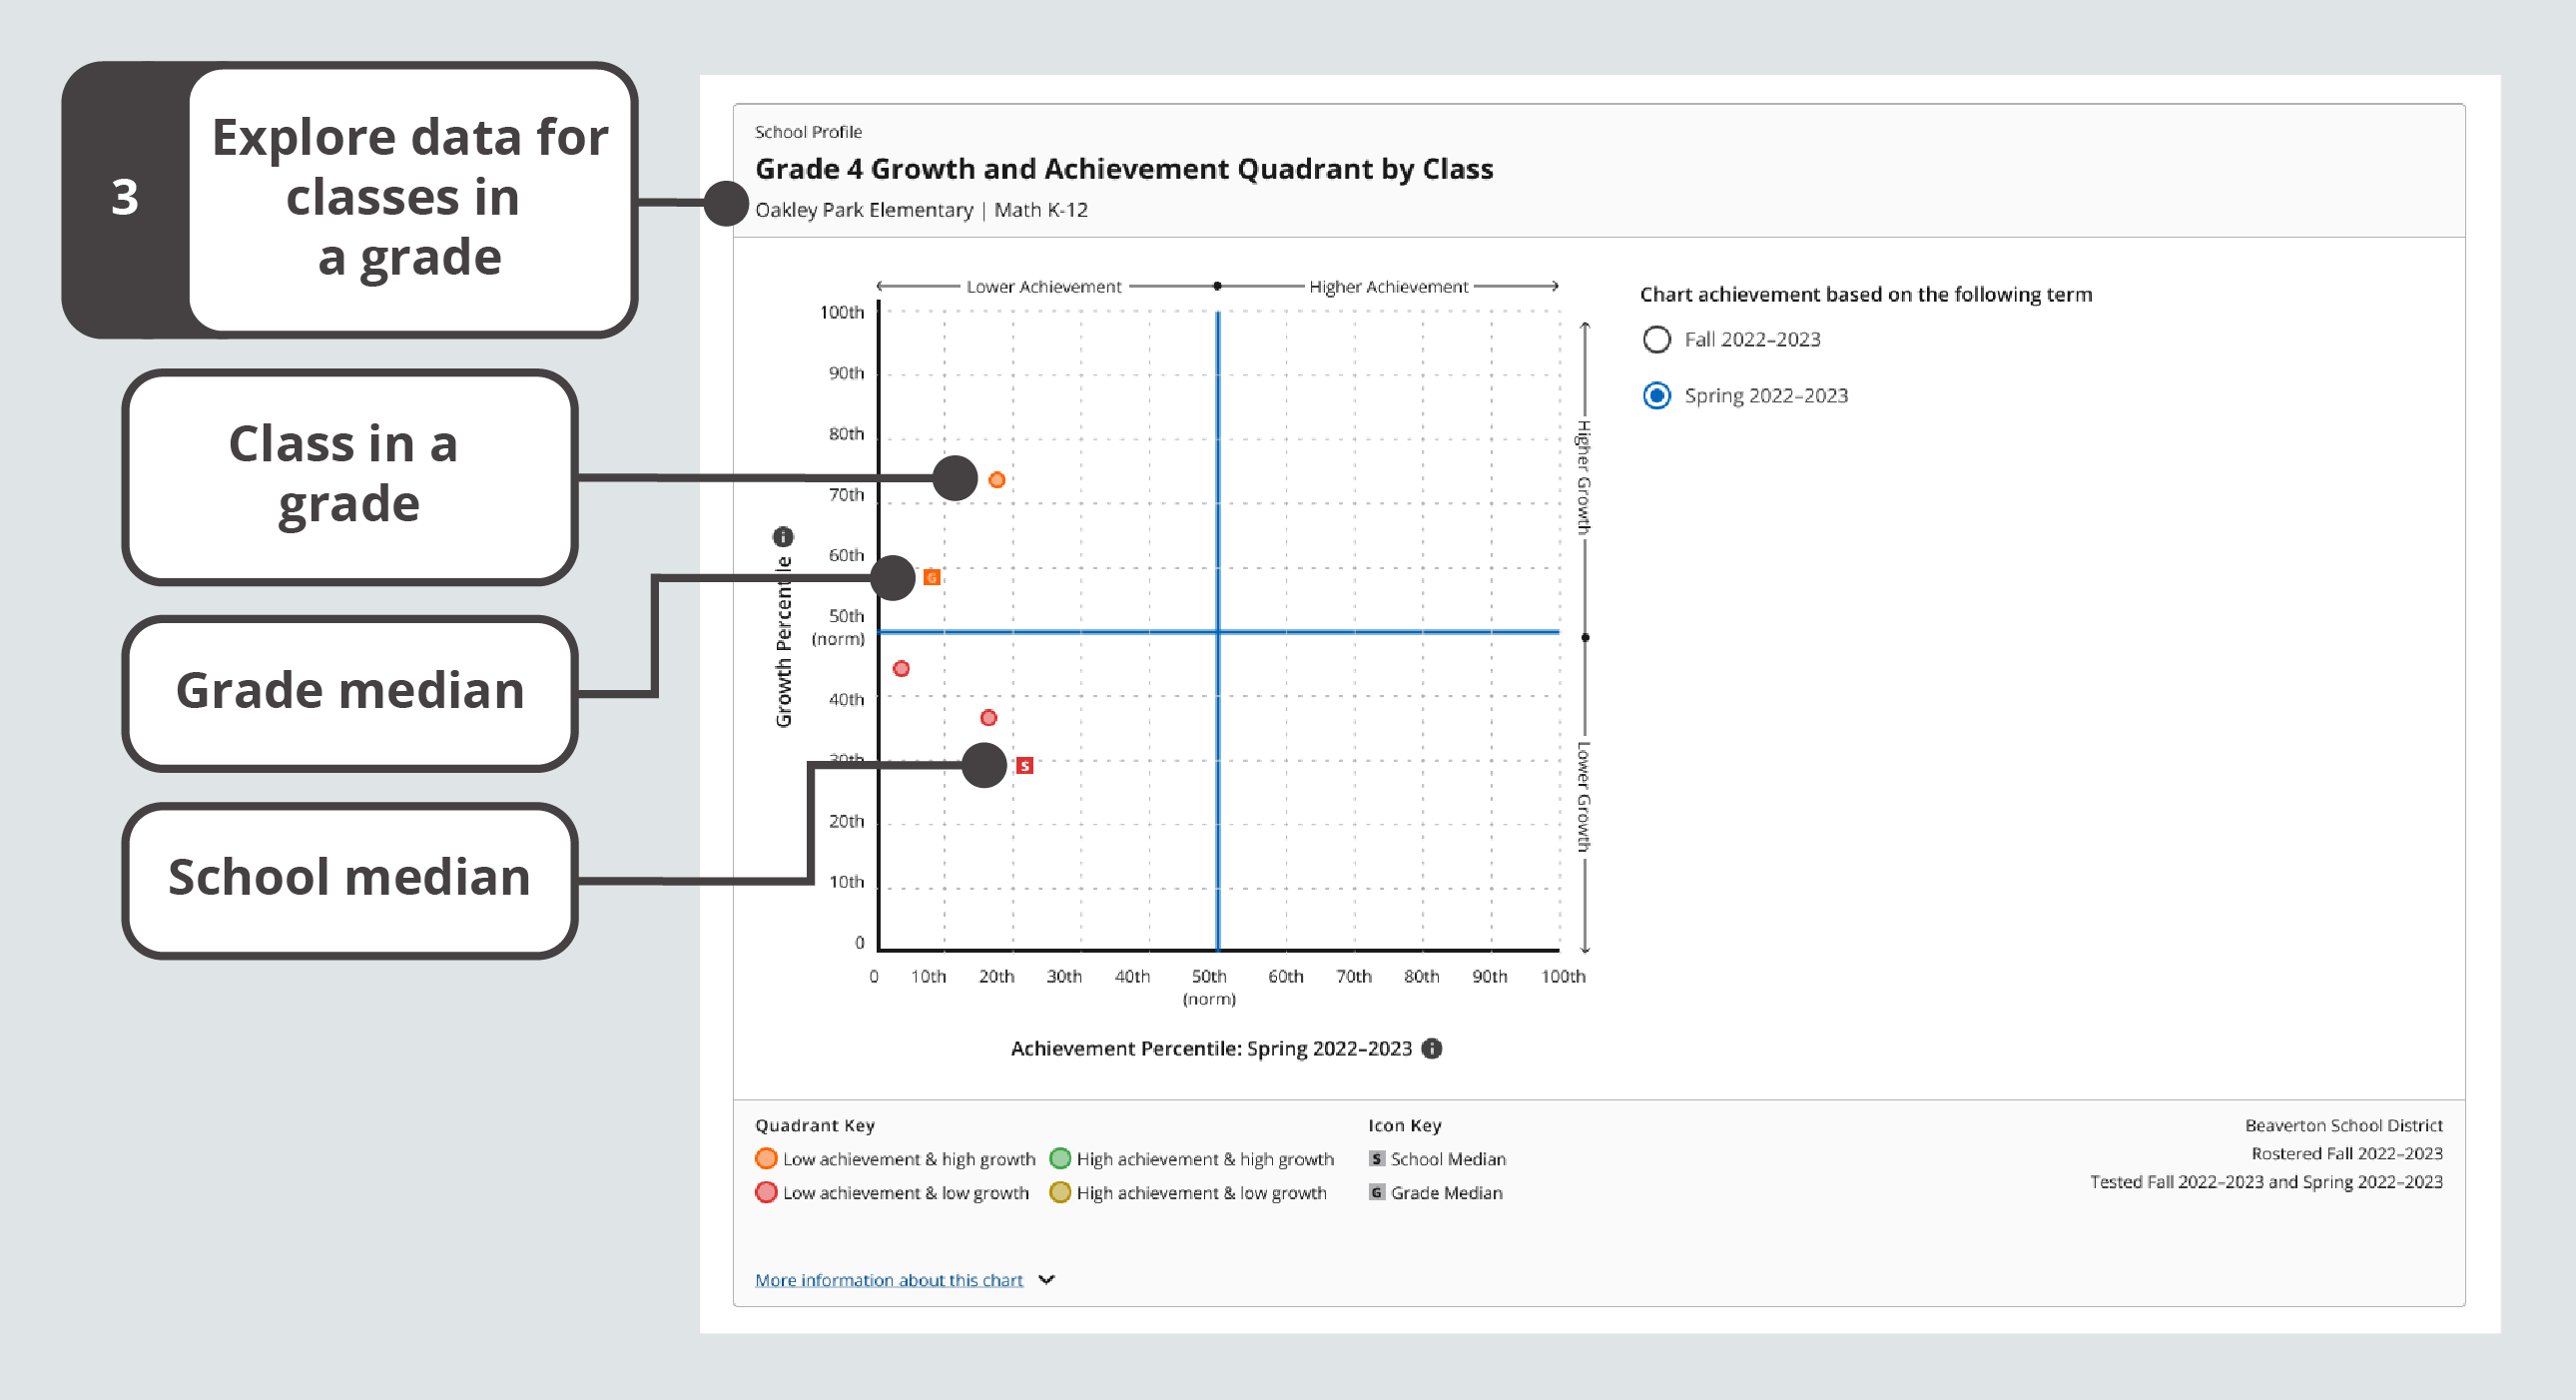
Growth and Achievement Quadrant with all classes in a grade
Note: The displayed data only represents students who are rostered to the selected grade. For classes with students in multiple grades, review each grade at a time or visit the Class Profile.
-
To return to all grades, select any of the data points or medians on the Growth and Achievement Quadrant.
-
In the expanded class information popover, select Return to all grades.
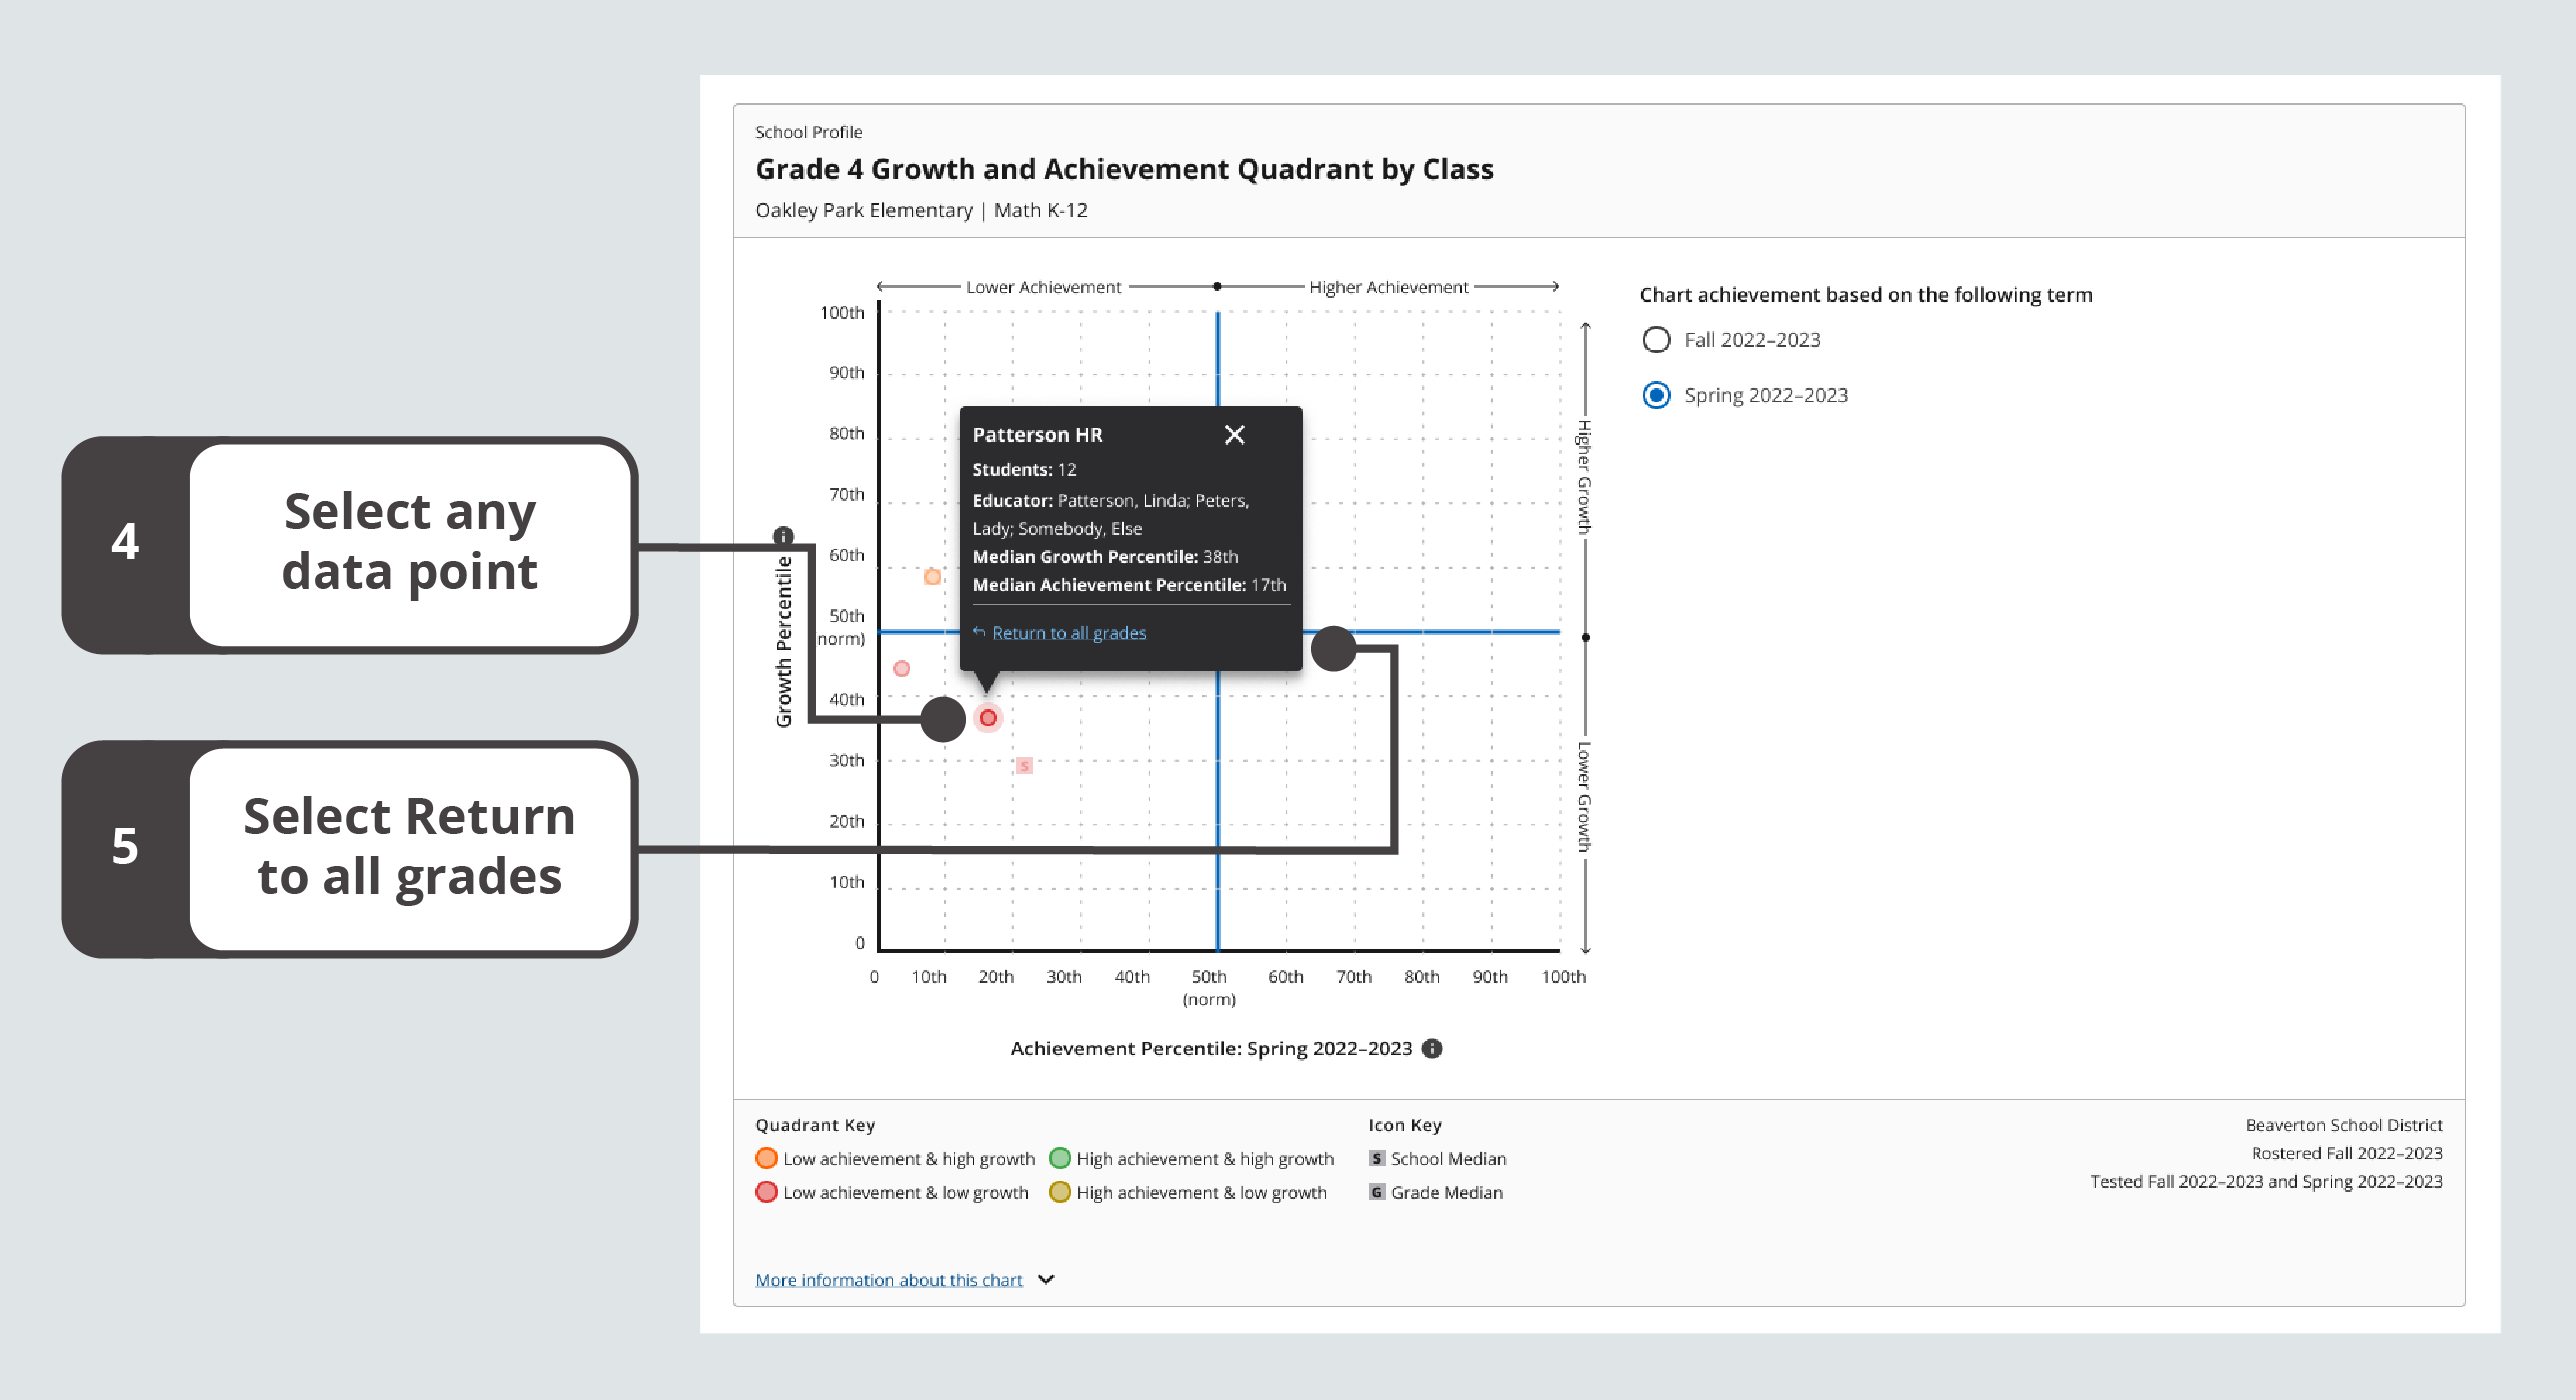
Growth and Achievement Quadrant with an expanded class information popover
Note: You can also use All grades at the top of the page to return to a view of all the grades.
Adding optional filters for classes
In addition to the grade filters for Ethnicity, Gender, and Program, you can find class filters for Class Name and Educator. These filters are available on both the Single-Term Achievement and Growth and Achievement tabs.
To apply class filters:
-
Select Apply Filters to expand the Filters section.
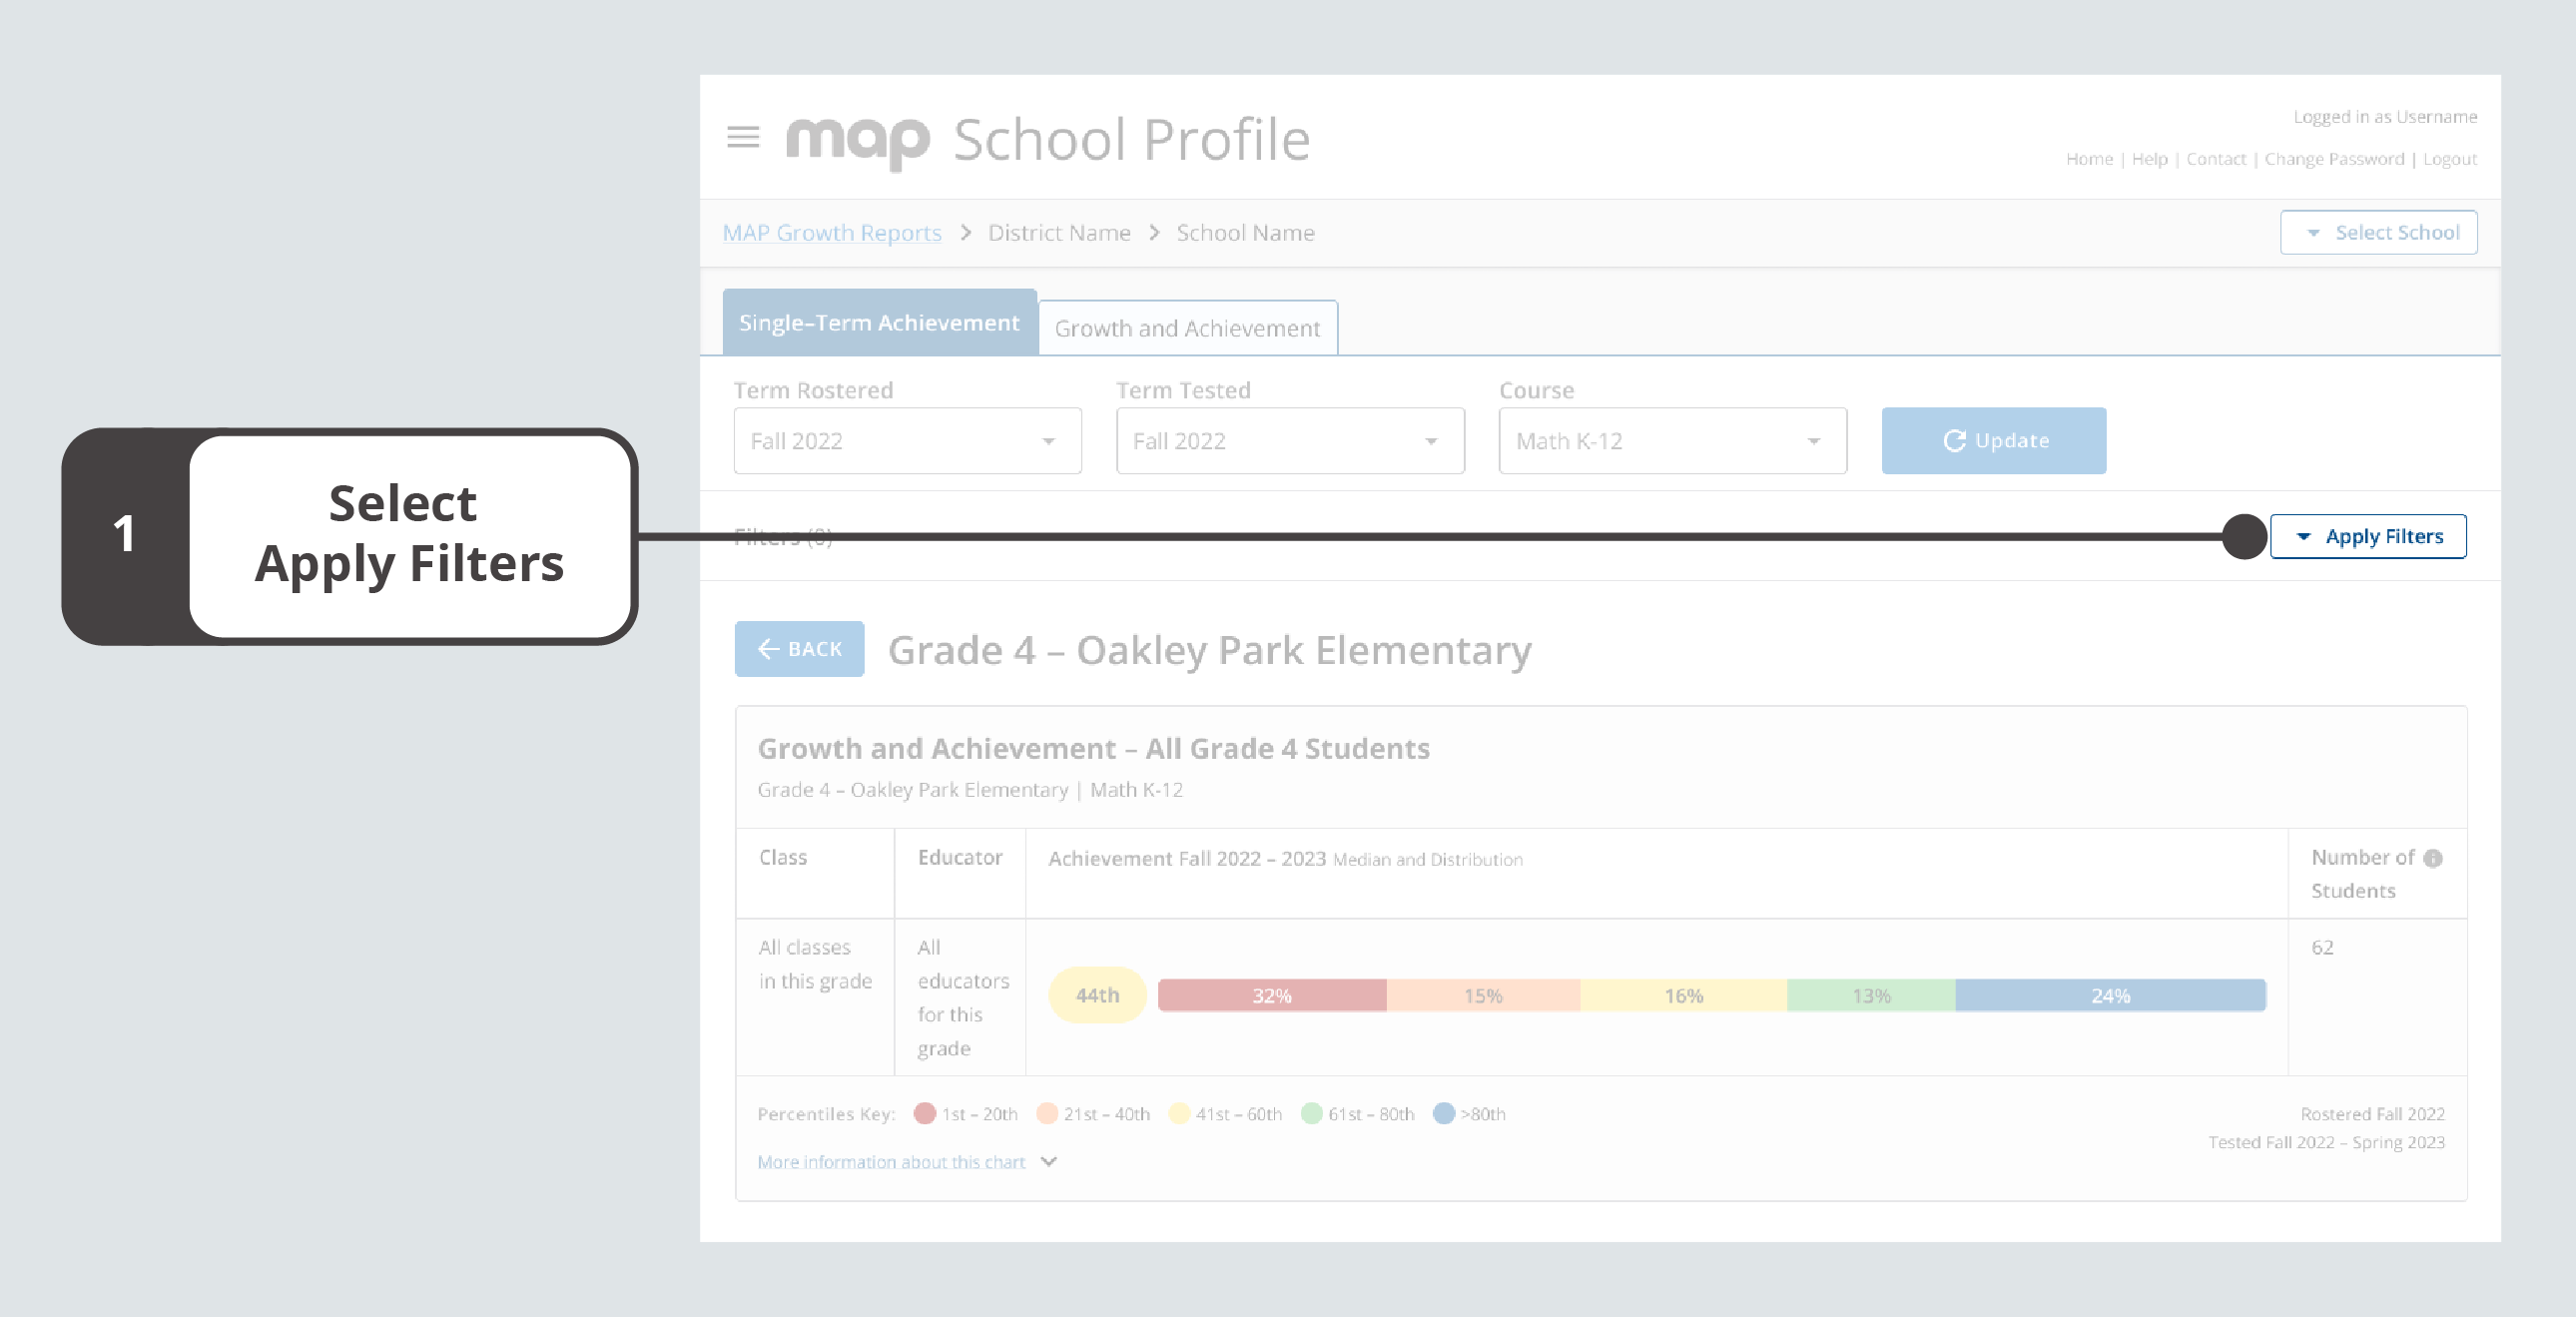
Single-Term Achievement tab with Apply Filters highlighted
-
From the drop-down menus that appear, select options for any or all filters for Ethnicity, Gender, Program, Class Name, and Educator.
Optional Ethnicity, Gender, Class Name, and Educator filters
You will only find filter options that apply to your selected data from the required fields. Additionally, no results will display if no data matches your filter selections.
To learn how to remove filters, see Clearing optional filters.
Reviewing student details
As you explore medians and distributions on the School Profile report, you may be interested to know about the students whose scores make up the aggregate data you're viewing. You can find student details for an entire distribution or for a single quintile on both tabs of the School Profile report.
Accessing student data
-
Choose data to review.
-
For all students across a distribution, select any median percentile, represented as a colorful pill shape before the percentile breakdown by quintiles.
-
For a subset of students in a particular percentile range, select any quintile band, represented as a colorful rectangular section of a percentile distributions.
Single-Term Achievement tab with a median percentile and quintile band highlighted
-
-
Explore students’ performance details. You can sort the data by any of the column headers.
-
Use the X to close the student details table.
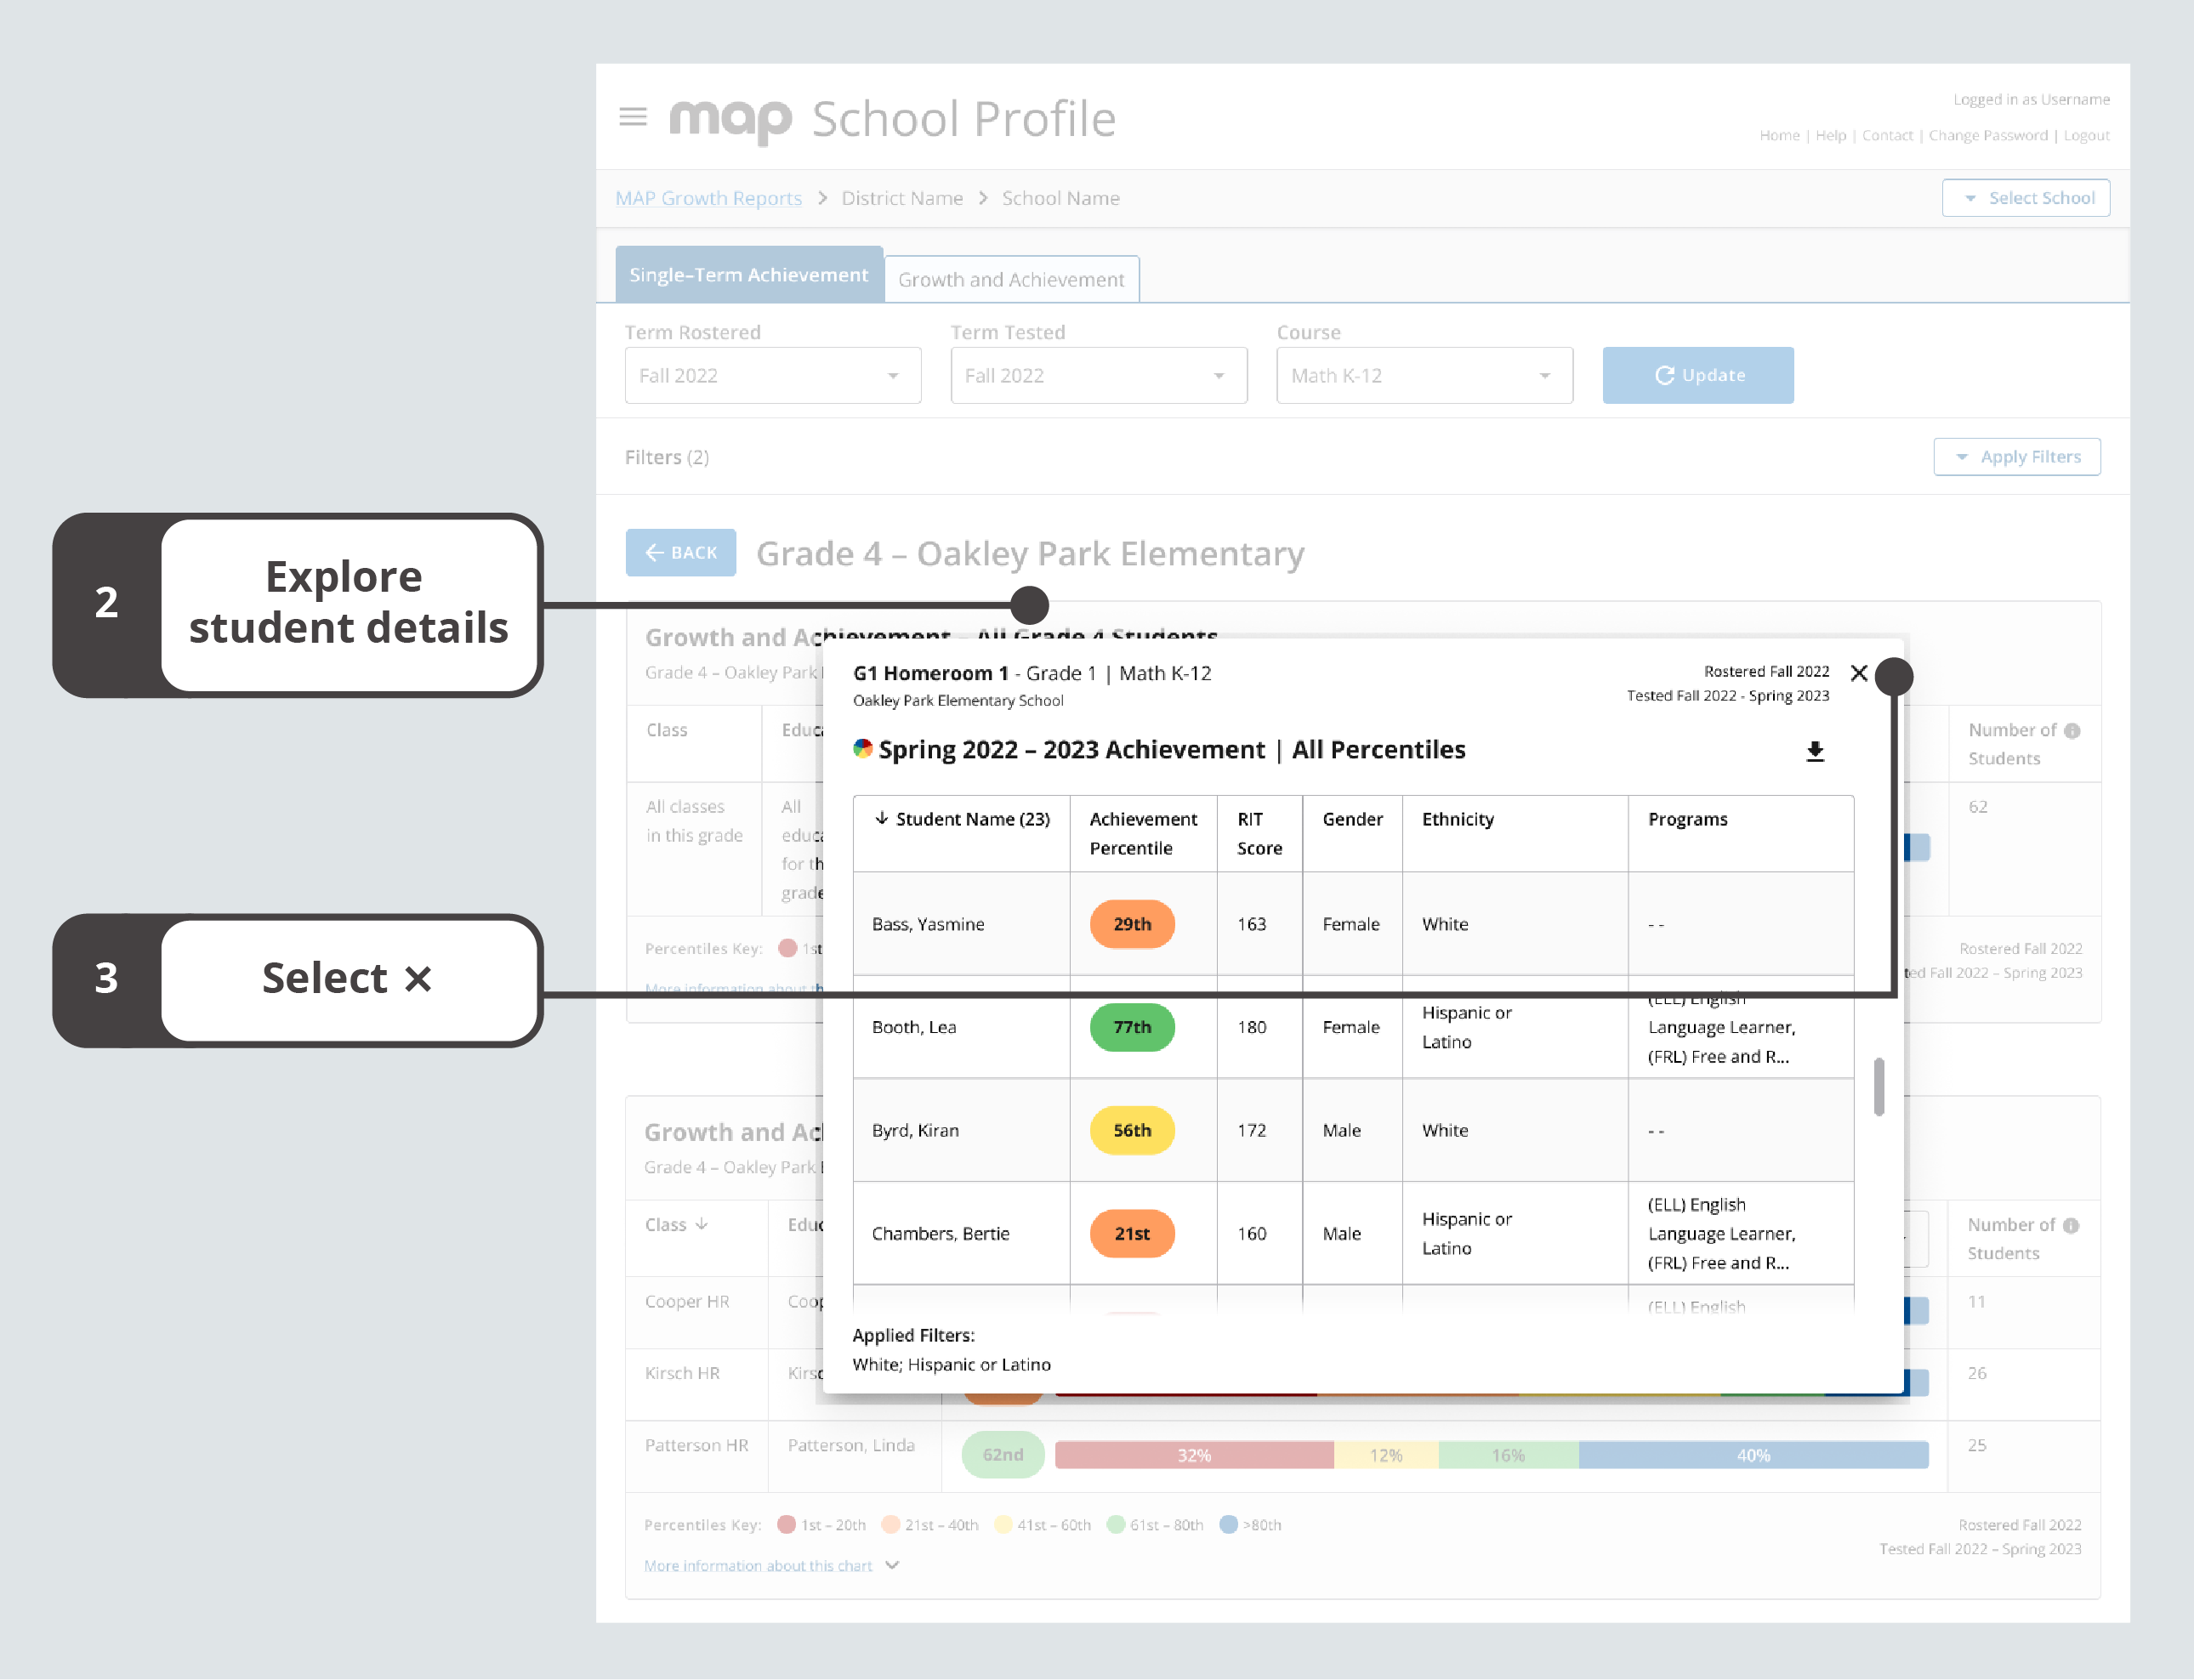
Student details for an entire distribution (all percentiles)
Understanding student details for achievement data
In the Student Name column, you can find the number of students in the quintile or distribution you’re viewing. For each student, you can review the achievement percentile, RIT score, gender, ethnicity, and programs.
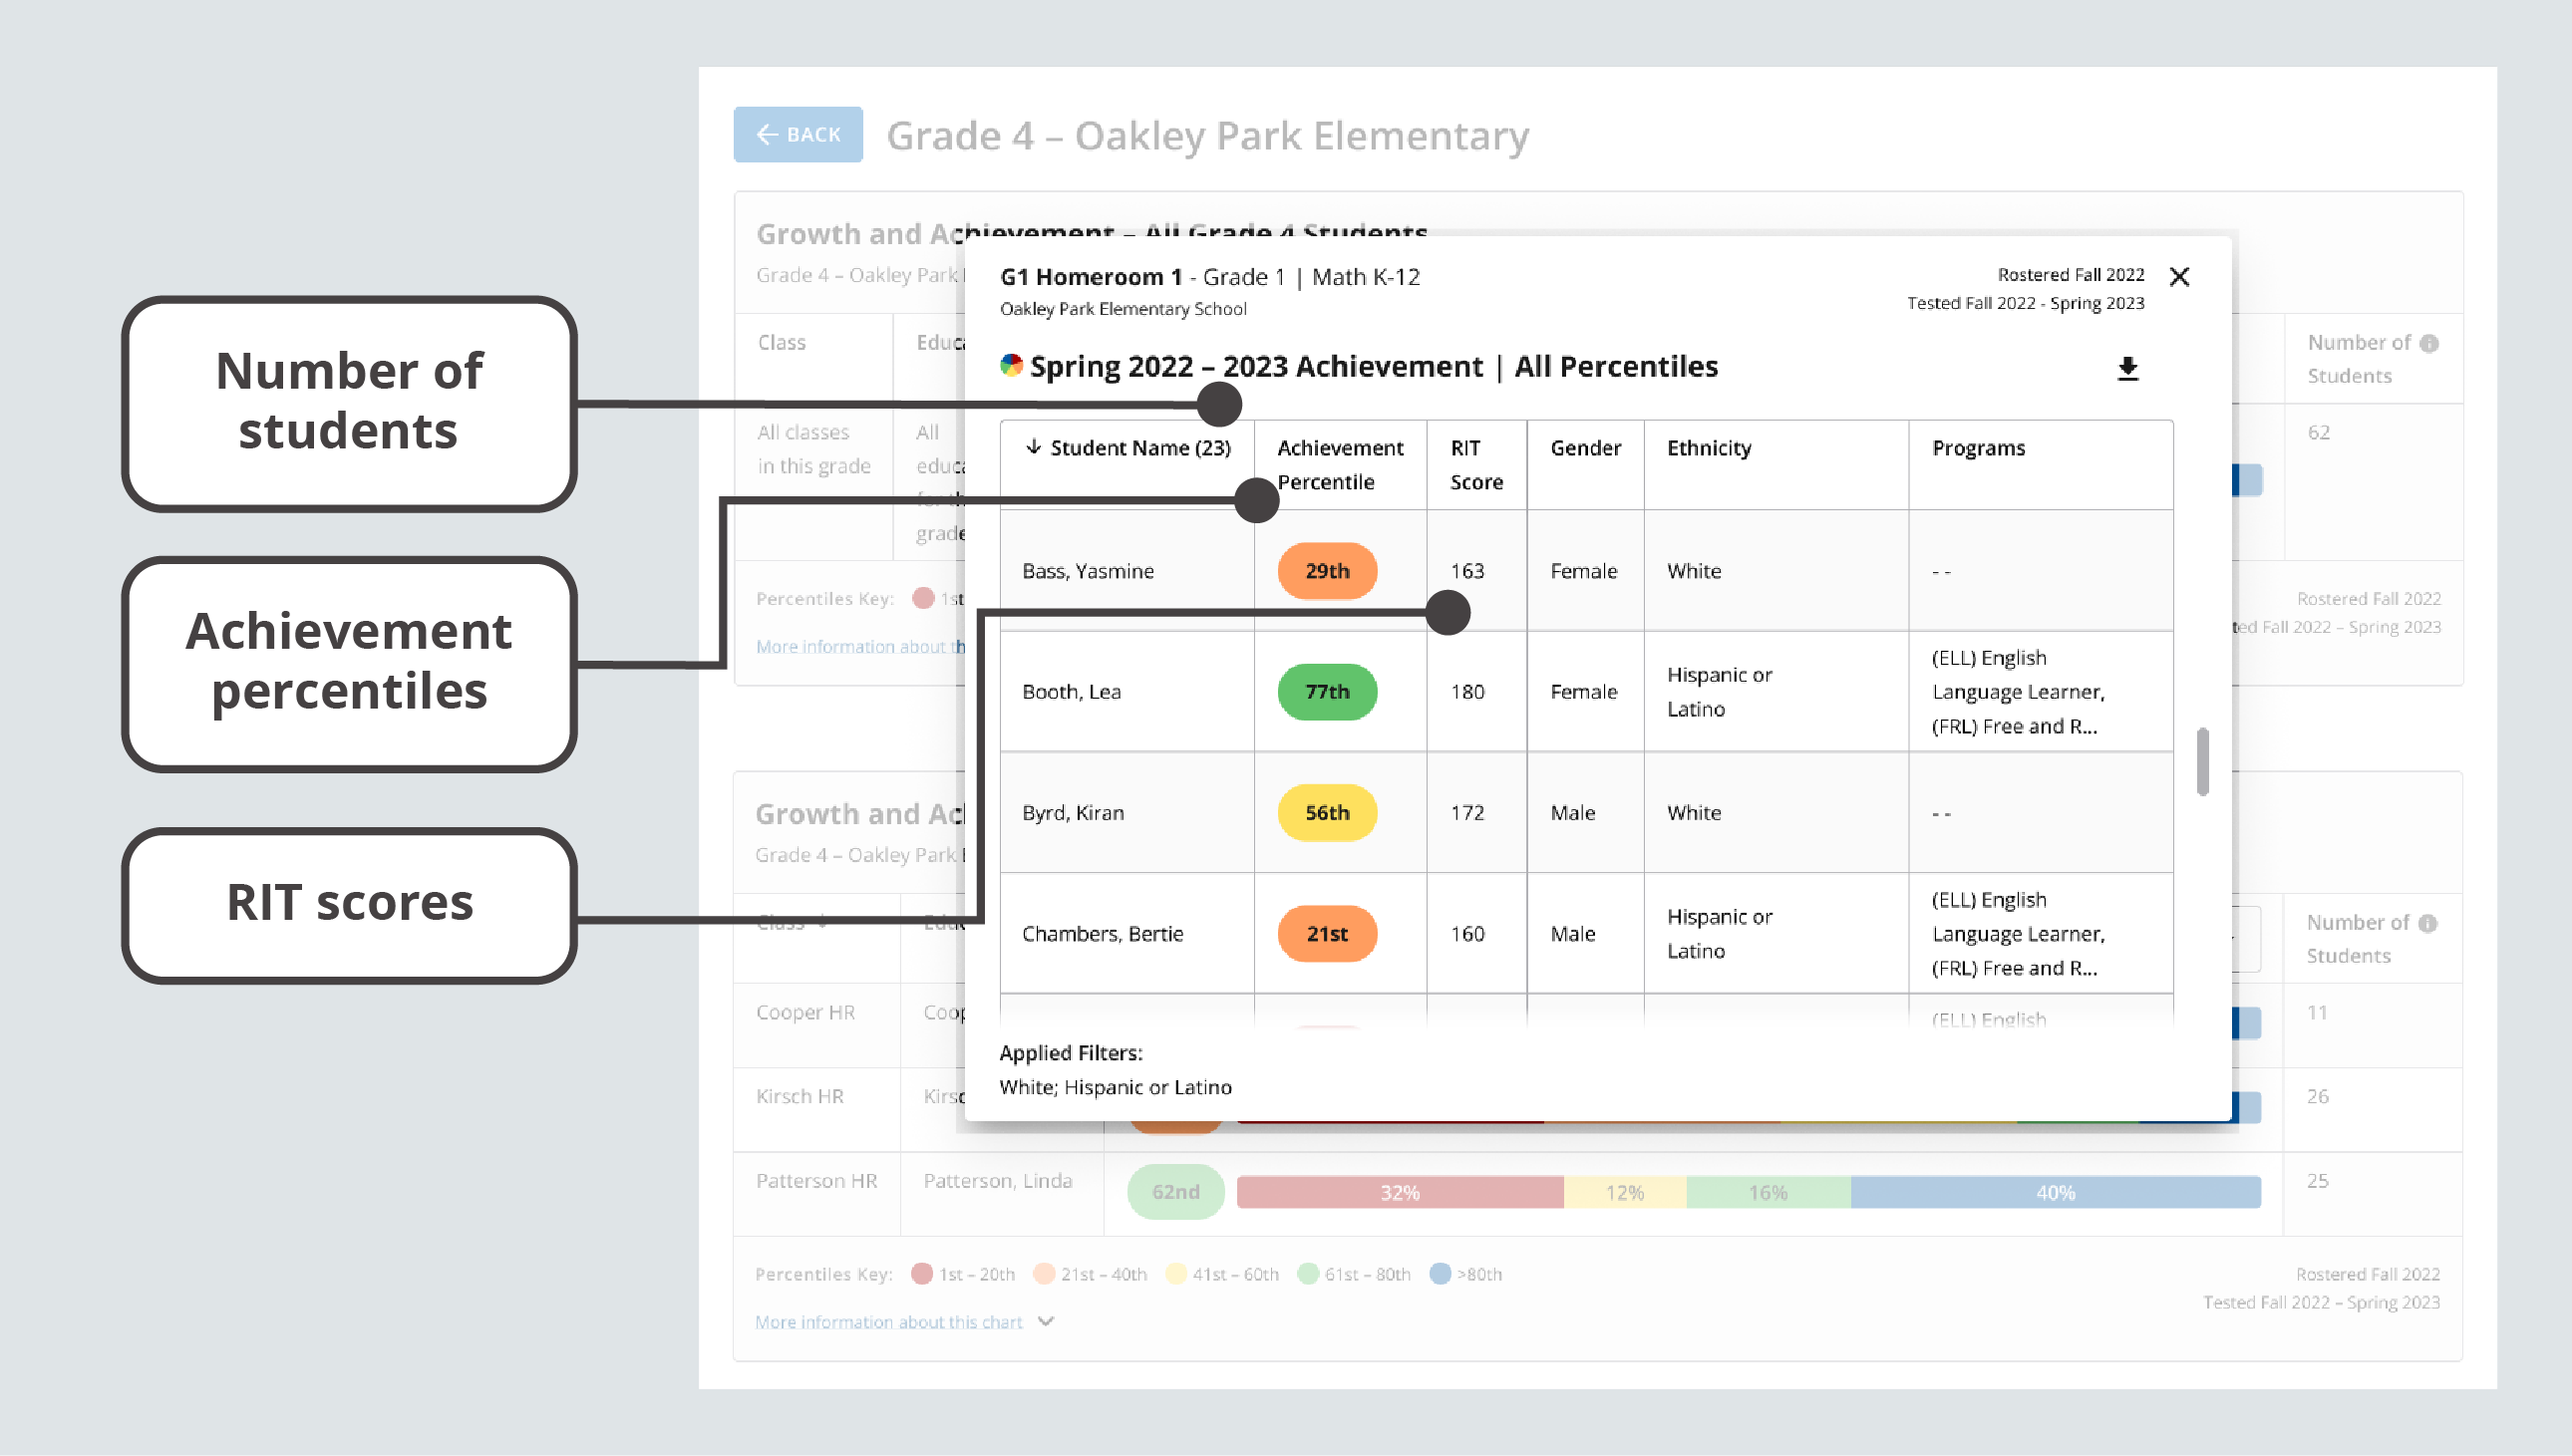
Achievement data in the student details table
| Data Point | Explanation |
|---|---|
| Student Name and Number of Students | The Student Name header of the student details table displays the number of students in the table you’re reviewing. |
| Achievement Percentile |
Norm-based information about where a student’s observed score from a single test event falls within the range of scores produced by other same-grade US students. |
| RIT Score | A student’s overall scaled score on the test for a given subject. For more details, explore RIT Scores. |
| Gender, Ethnicity, and Programs | Values assigned as a part of the roster process. Learn more about Programs Setting Up Student Programs for Reports. |
Understanding student details for growth data
In the Student Name column, you can find the number of students in the quintile or distribution you’re viewing. For each student, you can review the growth percentile, observed growth, projected growth, gender, ethnicity, and programs.
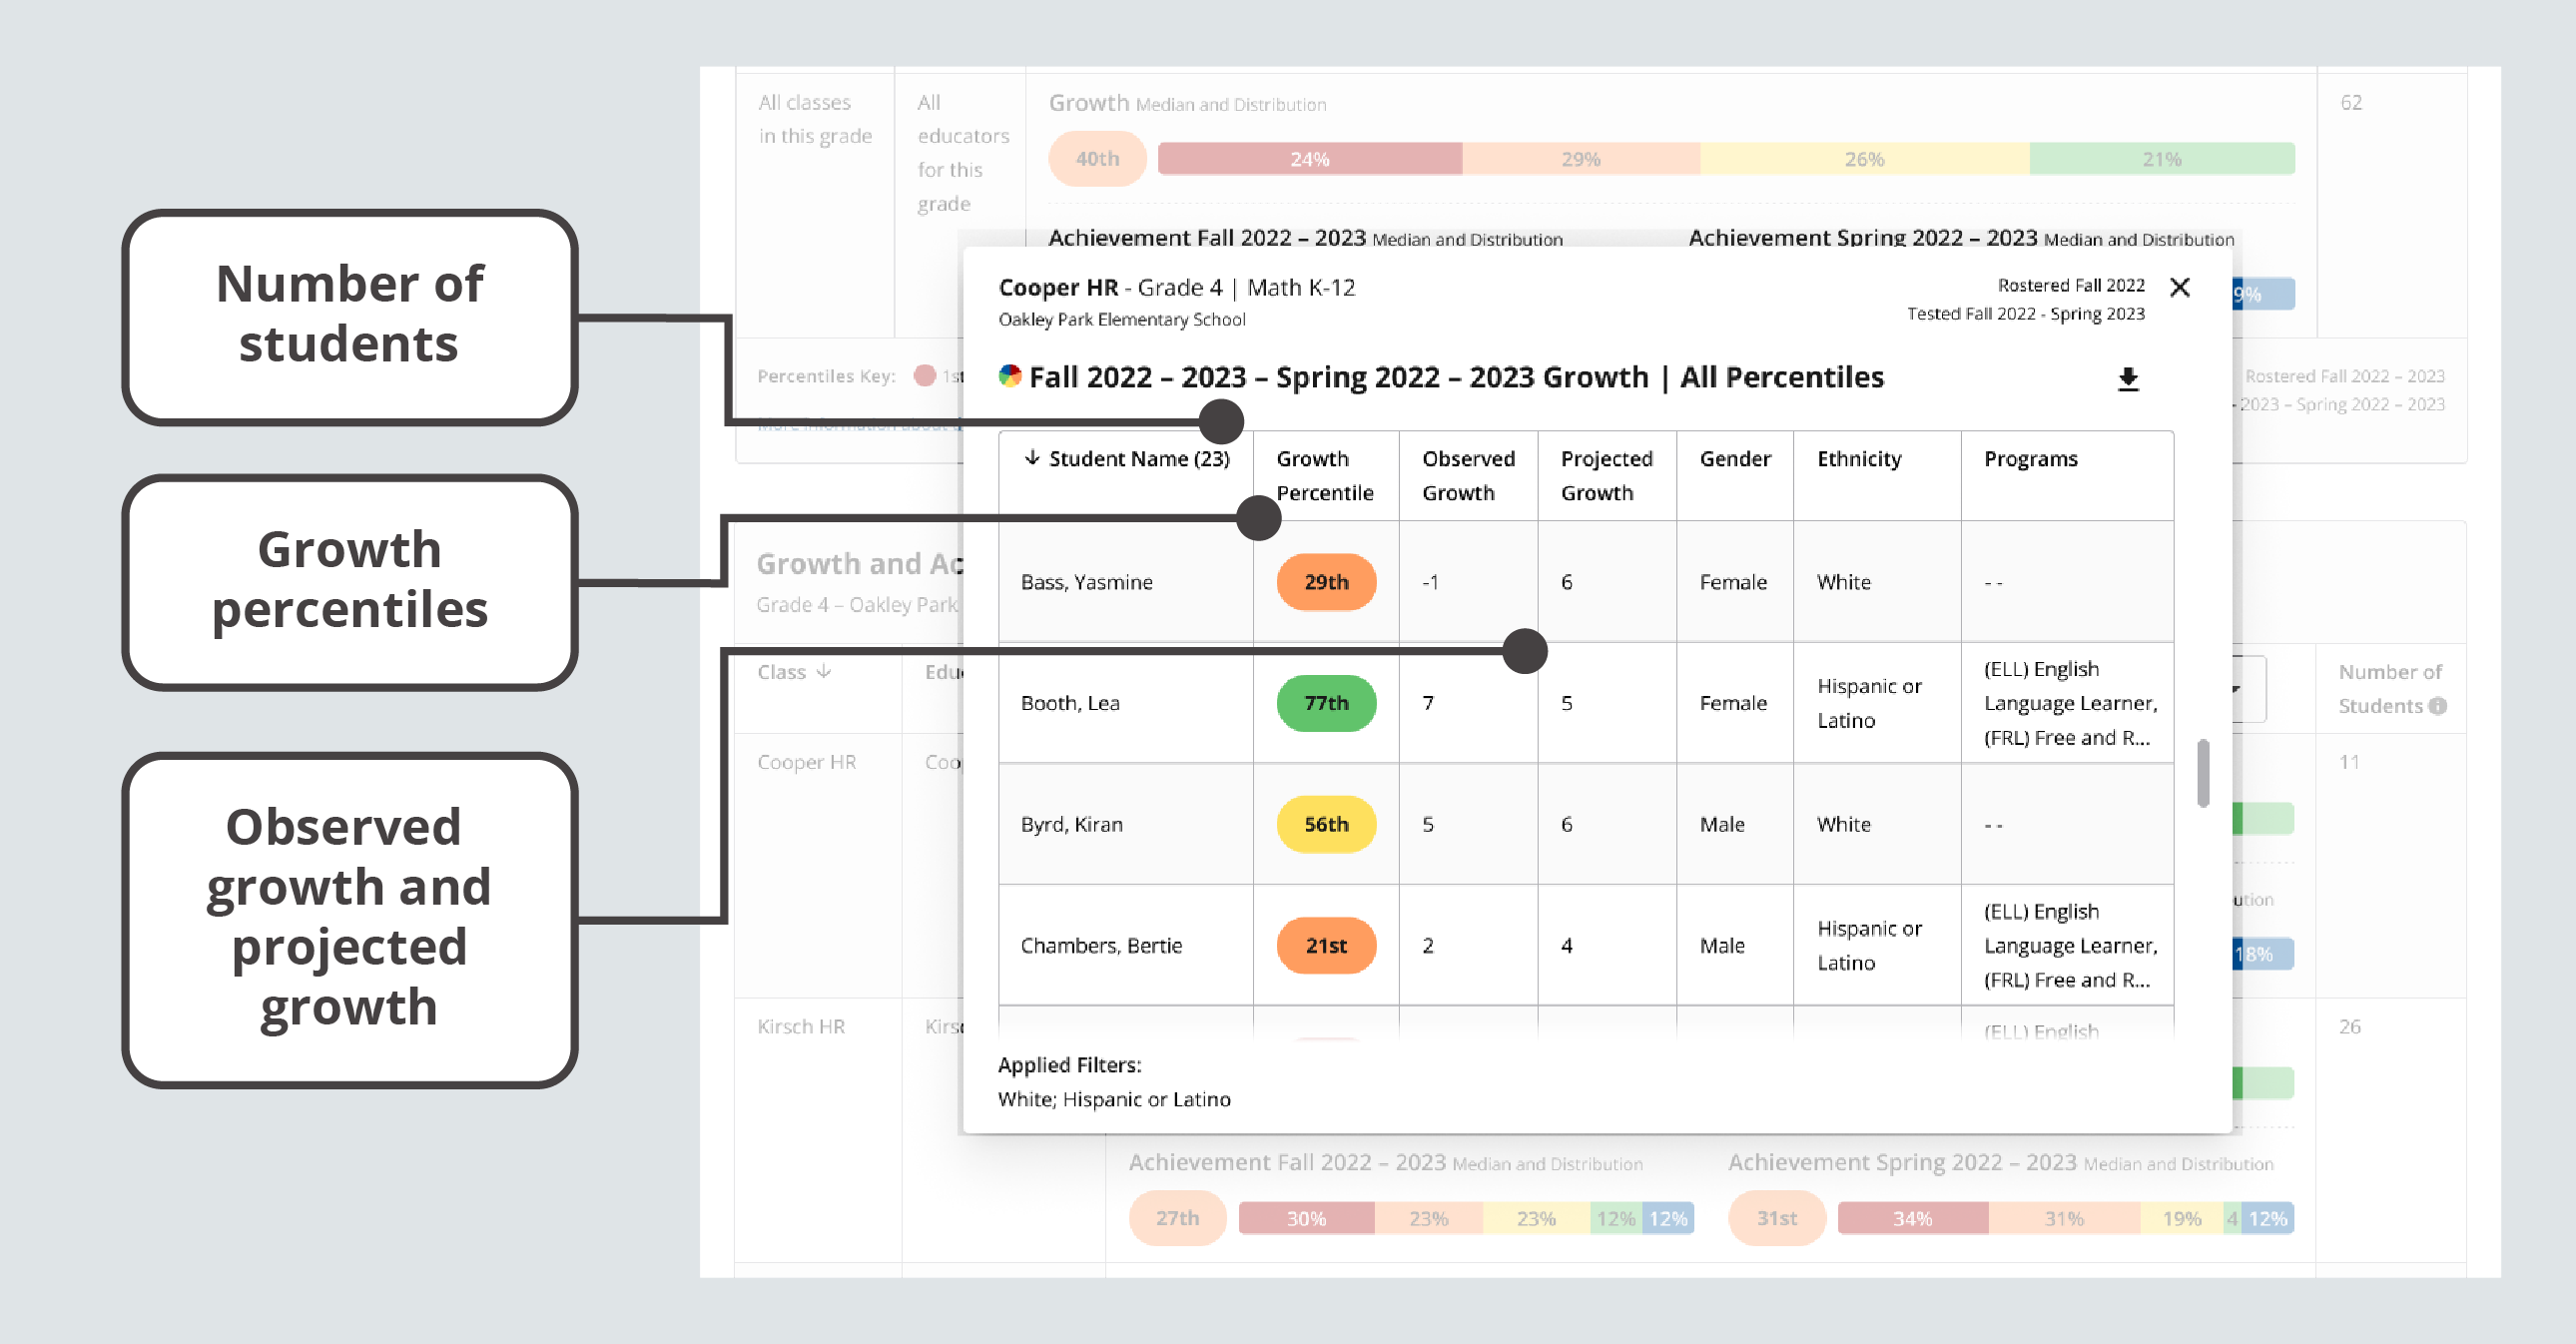
Growth data in the student details table
| Data Point | Explanation |
|---|---|
| Student Name and Number of Students | The Student Name header of the student details table displays the number of students in the table you’re reviewing. |
| Growth Percentile |
Norm-based information about where a student’s observed growth between two test events falls within the range of growth produced by other same-grade US students. |
| Observed Growth | The actual RIT point difference between the start and end term of the Comparison Period. |
| Projected Growth | The expected RIT point difference between the start and end term of the Comparison Period, based on the growth of matching peers in the NWEA norms study. |
| Gender, Ethnicity, and Programs | Values assigned as part of the roster process. Learn more about Programs Setting Up Student Programs for Reports. |
Applying insights
The wealth of customizable options and data visualizations in the School Profile report can help you understand complex situations and, in turn, make better decisions. Explore the ideas below for when to use this report and the kinds of questions it can help you answer.
When to use the School Profile report
Consider using the report at these times:
-
After testing, to see achievement data, and after testing across multiple terms, to compare achievement data and monitor achievement trends
-
When trying to identify the impact of past decisions (e.g., additional intervention resources, a new curriculum, etc.)
-
When evaluating where to allocate extra resources to maximize student growth
-
When analyzing the performance of student subpopulations to ensure equitable student outcomes
-
When finding areas of success for celebration and motivating staff and students
-
When facilitating staff conversations about school performance and trends
-
When sharing school-level performance with district and state stakeholders
How to use the School Profile report
The School Profile can help you answer these questions:
-
How is a grade doing overall?
-
Is one grade performing better in some courses than others (e.g., math vs. reading)?
-
Which classes in each grade need the most support? Which classes are excelling?
-
What differences exist when examining this grade's performance in a subject by ethnicity and gender?
-
Are there trends in achievement at the grade level year after year or between terms?
-
What was the impact of a major change that was made last year? Did it result in any positive change at the school level?
-
Are more students gaining one or more quintiles over time?
-
How much are students growing compared to similar students in the NWEA norm group?
-
Which grades and classes are showing the most or least growth?